Quick answer: Download executive slide templates when the slide structure is well-understood and the value is in the content (board updates, capital cases, status reports). Build from scratch when the structure itself is part of the argument (a new strategic narrative, a one-off pitch, a reframing slide). Most senior presenters need ~80% downloaded and ~20% custom. The mistake is thinking it has to be one or the other.
In this article
Priya runs corporate development for a UK-listed industrials business. Last quarter she was preparing a £40m capital case for the board, an internal strategy update for the executive committee, and a pitch deck for a partnership the CEO had asked her to scope. Three decks. Three audiences. Three deadlines inside ten working days. She started all three the same way: blank slide one, blinking cursor.
By day six she had finished none of them. The capital case was 40% built but felt structurally wrong. The strategy update kept losing its thread. The partnership pitch had gone through four openings, none of them right. Her CFO walked past her office and said, quietly, “you do not need to design every slide from scratch — there are templates for this.” She bought a senior-level template pack that night, finished the capital case the next morning, and used the time it freed up to do the partnership pitch properly.
She did not realise it at the time, but she had answered the most useful question a senior presenter can answer about template work: when does downloading save you, and when does building from scratch matter?
If you keep starting decks from blank slides
The Executive Slide System gives you 26 templates, 93 AI prompts, and 16 scenario playbooks built for senior-level presentation work — board updates, capital cases, strategy reviews, change proposals. Designed so you start from a structured slide that already knows what executive readers need.
Why this question matters more in 2026 than it did three years ago
Three years ago, executive slide templates were a smaller market and a bigger compromise. The downloads available looked generic — corporate stock imagery, brittle layouts, fonts that broke in branded environments, structures that felt right for a startup pitch and wrong for a board audit committee. Senior presenters who tried them often came away with the same conclusion: faster, but the output looked lighter than the audience deserved.
That has changed. Two things shifted. First, the template market matured. Senior-level template packs now exist that were built by people who actually present at executive level — not designers reverse-engineering what they think senior decks look like. The structures inside them assume a 12-person executive committee reading 90 seconds before any spoken commentary, not a sales floor cheering at the next reveal. Second, AI changed what “templated” means. With Copilot or ChatGPT, a downloaded template can be customised in minutes for a specific industry, audience, and argument — so the trade-off between speed and fit has narrowed.
The result is that the old binary — download cheap and look junior, or build from scratch and look senior — no longer holds. Senior presenters now face a more nuanced question: which type of deck genuinely benefits from custom structure, and which type is a structural problem that has already been solved?
When downloading is the right call
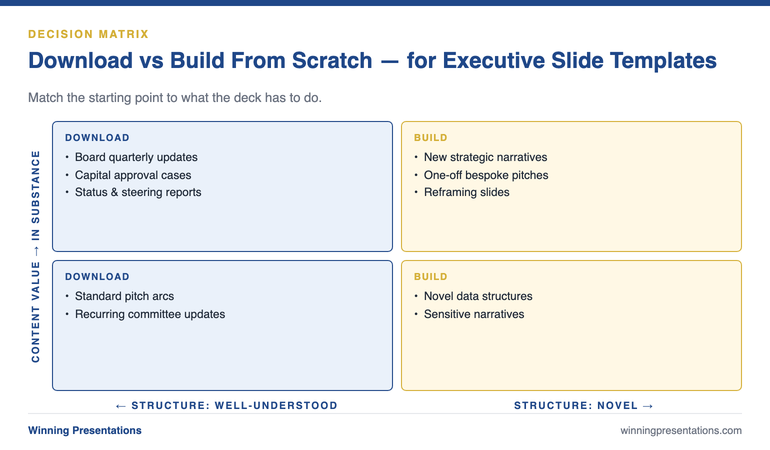
Downloading is the right call when the structural problem is well-understood and the value of the deck is in the content, not the form.
Board updates. A quarterly board update is a structurally solved problem. Executive committees and boards have read hundreds of them. They know what they want: performance against plan, risks, capital, decisions required. The structure is conventional because the structure works. Building it from scratch is a kind of vanity — your audience is not reading the deck to admire the format. They are reading it for the numbers and the judgement. A downloaded board update template that follows the conventional structure lets you spend your time on the content, which is where the value sits.
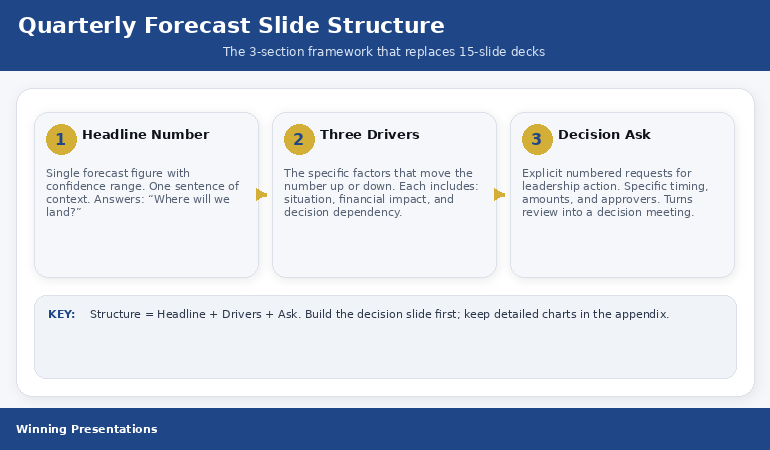
Capital cases. The structure of a capital approval case is also largely solved: the ask, the rationale, the alternatives considered, the financial case, the risks and mitigations, the implementation plan. Investment committees read them in roughly that order regardless of what you put on which slide. A template that already has these sections in place removes 70% of the structural decisions and lets you focus on the analysis. The strategy directors who consistently get capital approved are not the ones with the most beautifully bespoke decks. They are the ones whose decks the committee can read in eight minutes without losing the thread.
Status reports and steering committee updates. Same principle. The audience knows what they are looking for, the structure is conventional, and your time is better spent on the substance than on reinventing the form.
Pitch decks following a known structure. A standard fundraising or partnership pitch follows a recognisable arc — problem, solution, market, traction, team, ask. The downloaded template is not lazy here; it is meeting investor expectations of how to read a deck. Senior pitches that deviate too far from the arc tend to confuse investors, who lose patience faster than entrepreneurs realise.
When building from scratch is worth the time
Building from scratch is worth the time when the structure of the deck is itself part of the argument.
A new strategic narrative. When you are introducing a strategy that the audience has not heard before — a different way of framing the business, a fundamentally new direction — the structure of how you walk them through it matters. A downloaded “strategy update” template assumes the audience already understands the framing. If your job is to teach them the framing, the template will fight you. The unfolding of the argument is the work, and unfolding requires a custom slide path.
One-off high-stakes pitches. A bespoke pitch to a specific board, regulator, or partner — where you know exactly who is in the room and what their starting position is — sometimes warrants a custom build. Not always. Most of the time the standard pitch arc still works. But when you are pitching to one decision-maker whose objections you can predict in advance, structuring the deck around their specific objections rather than the generic arc can be the difference between progress and a polite “thank you.”
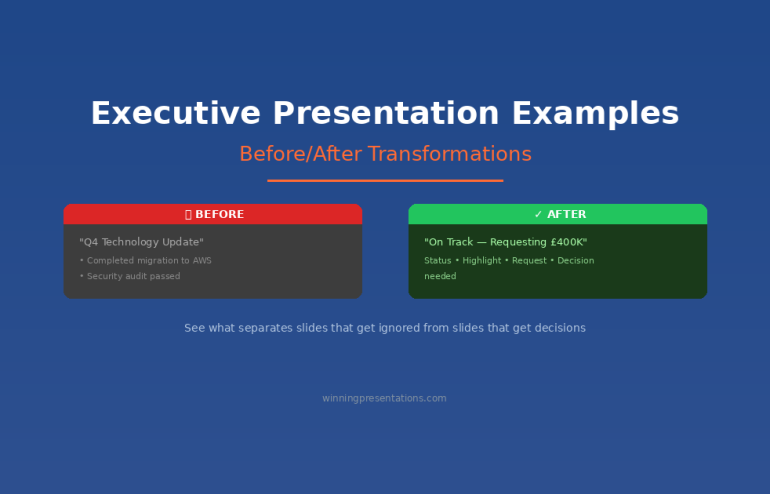
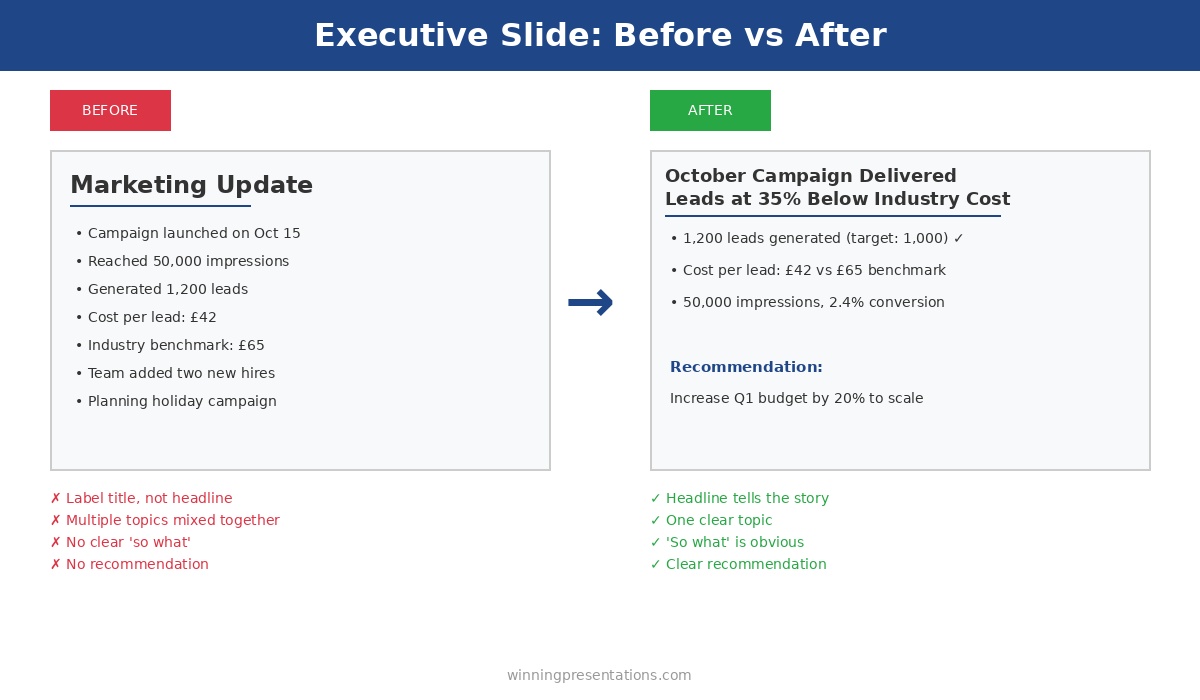
Reframing slides. Every senior deck has one or two slides whose job is to change how the reader sees the problem. The slide that recasts a cost discussion as an investment discussion. The slide that reframes a competitive threat as a strategic option. The slide that turns “we missed plan” into “here is what we have learned about the market.” These slides almost always need to be built from scratch because what they are doing is unconventional. A template will not have a layout for “make my reader see this differently than they did 30 seconds ago.”
Slides that carry novel data structure. If you are presenting a unique chart, a custom matrix, or a comparison framework that your audience has not seen before, the slide containing it is custom by definition. The template would just be a frame around the part you have to design yourself.
A 60-second test to apply before every deck
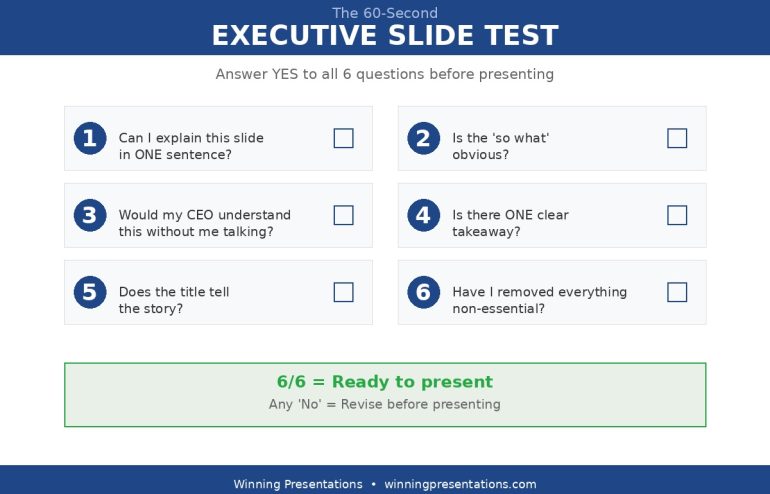
Before you start any executive deck, ask yourself three questions in sequence. They take less than a minute and they protect you from spending hours building something that should have been downloaded — or downloading something that needed to be built.
Question one: has my audience read a deck like this before? If yes, the structure is solved and a template is appropriate. If no, you may need to build the structural part yourself so the unfamiliar argument has a clear path through it.
Question two: is the value of this deck in its structure or in its content? If the value is in the content (the numbers, the analysis, the recommendation), use a template and put your time on the content. If the value is in how you reframe the structure itself (a new way of seeing the problem), build the structure custom.
Question three: how much time do I genuinely have? Be honest. If you have eight working days and three decks to deliver, “I will design this from scratch because it deserves it” is rarely a real option — it is wishful thinking that ends in a half-finished deck the night before. Templates exist for the times when the deck deserves to be good and your time is finite. Both of those things are usually true.
Stop starting from blank slides for the structurally solved decks
The Executive Slide System gives you a structured starting point for the 80% of executive decks where the structure is already well-understood. Use the template, free up the time, and put it where it actually changes outcomes — on the analysis and the reframing slides.
- 26 templates covering board updates, capital cases, change proposals, strategy reviews, and pitch arcs
- 93 AI prompts to customise each template for your industry, audience, and argument
- 16 scenario playbooks for the difficult variants — hostile boards, sceptical CFOs, regulatory pre-reads
- £39, instant download, lifetime access
Get the Executive Slide System — £39 →
Designed for senior professionals presenting to boards, executive committees, and investment panels.
The 80/20 hybrid most senior presenters end up using
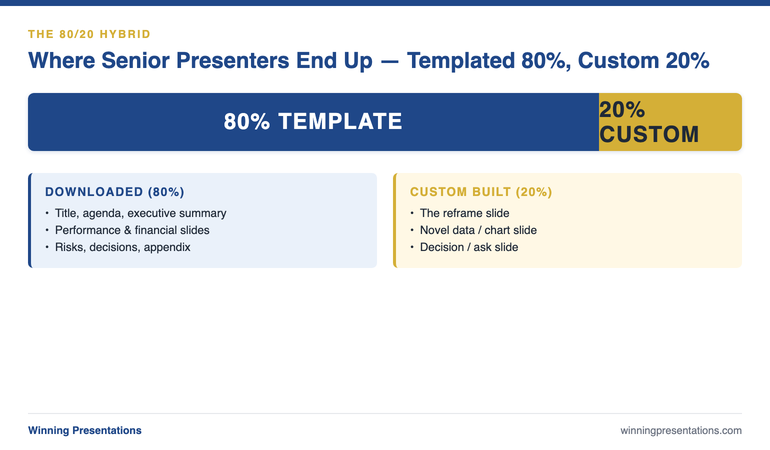
Senior presenters who have been doing this for a decade or more rarely treat the question as binary. The pattern they settle on is roughly 80% template, 20% custom — and the 20% is concentrated on the slides that carry the most decision weight.
The 80% is everything that follows convention: title slide, agenda, executive summary in pyramid form, performance overview, financial summary, risks, decisions, appendix. These are downloaded, customised lightly with branding and content, and finished quickly.
The 20% is the slides where the argument turns. The reframe slide. The chart that carries the new data point. The decision slide that makes the ask explicit. These are built from scratch because they are doing structural work that no template can do for you. A senior presenter who can identify which 20% of their deck deserves custom design — and protect their time accordingly — produces consistently better decks than one who treats every slide as either equally templated or equally bespoke.
Three mistakes to avoid in either approach
Mistake one: downloading a template and not editing it. A template is a starting structure, not a finished deck. The Lorem Ipsum body copy, the placeholder photos, the generic chart titles — every one of them needs to be replaced before a senior audience sees the slide. The fastest way to look junior with a downloaded template is to leave any of the template’s own copy visible. Set a rule: before any executive deck goes out, scan every slide for any element that came from the template untouched. Replace them all.
Mistake two: building from scratch as a procrastination tactic. Designing slides feels productive. It looks like work, it shows progress, and it postpones the harder problem of deciding what the deck is actually arguing. If you find yourself spending three hours on a single slide’s design when you have not finalised the recommendation, the design work is procrastination. Stop. Pick a template. Force yourself back to the structural and analytical decisions that actually drive whether the deck succeeds.
Mistake three: mixing template visual languages. If you download templates from three different sources to assemble a single deck — one for the title, another for the financials, a third for the appendix — the deck will read as visually inconsistent even if you do not consciously notice why. Senior audiences absolutely notice. The fix is to commit to a single template family for any given deck and live with its limitations on a few slides rather than borrowing from elsewhere. For a deeper look at the structural side of this question, see the partner article on when each approach saves or kills your board presentation.
The download-vs-build decision is one of the highest-leverage choices a senior presenter makes, and most people make it badly because they default to one approach for everything. The presenters who consistently produce good decks under time pressure have learned to ask which type of deck this is — and to spend their precious 20% of custom design on the slides that actually move decisions.
For senior presenters whose templates have to support board-level approvals, the structural side and the persuasive side both matter. The structural foundations of executive buy-in are worth reading alongside any template selection process — because the right template for the wrong argument still loses the room.
If you want a tactical starting point that already understands senior-level deck structure, the Executive Slide System (£39) includes 26 templates designed for the conventional 80% — and frees up your time to build the 20% that needs custom work.
The full system, not just the templates
The Executive Slide System pairs 26 templates with 93 AI prompts and 16 scenario playbooks. Build board-ready executive slides in 30 minutes. £39, instant download.
Get the Executive Slide System →
Built for senior professionals across financial services, technology, and consulting.
FAQ
Are downloaded executive slide templates seen as junior by senior audiences?
Only when the template is clearly visible underneath the customisation — Lorem Ipsum left in, generic stock photos, placeholder titles. A well-customised template is invisible to the audience, who reads only the content. The “junior” perception almost always traces back to insufficient editing of the template, not the use of a template in the first place. Senior strategy teams use templates routinely; the difference is they edit them properly.
How long should it take to customise a downloaded template for a board deck?
For a 12 to 15-slide board update with content already prepared, a well-designed template should take 60 to 90 minutes to customise — branding, content replacement, chart creation, and a final review. If it is taking longer, either the template is fighting your content (wrong template choice) or the content is not yet finalised (you are designing your way through unsettled thinking).
Should I build my own template library or buy one?
Both, eventually. Most senior presenters start by buying a senior-level pack to get a structured baseline, then over time add custom templates of their own for the slides they build repeatedly that are not in the pack. After two or three years, your library is a hybrid — purchased templates for the conventional 80%, your own templates for the recurring custom work in your specific role. Building from absolute zero takes longer and produces a worse result for the first year.
Do AI tools change the download-vs-build calculation?
They narrow the gap. AI assistance lets you customise a downloaded template much faster than was previously possible — the prompt-driven editing of headlines, body copy, and chart commentary cuts customisation time roughly in half. AI assistance does not, however, change the underlying decision about which slides need custom structural design. The reframe slide still needs to be built; AI just helps you write the words once you have built it.
Get The Winning Edge — weekly
One sharp, story-led idea every Thursday on executive presentation craft, slide design, and the small decisions that change how senior audiences receive you. Read by senior professionals across financial services, technology, and consulting.
Not ready for the full system? Start here instead: download the free Executive Presentation Checklist — a one-page reference covering the structural moves that hold any executive deck together, templated or custom.
Pick your next deck. Run the 60-second test. Decide which 80% gets a template and which 20% gets your custom attention. Spend the saved time where it actually matters — on the slides that move the decision.
About the author. Mary Beth Hazeldine is Owner & Managing Director of Winning Presentations Ltd, founded 1990. With 24 years of corporate banking experience at JPMorgan Chase, PwC, Royal Bank of Scotland, and Commerzbank, she advises executives across financial services, healthcare, technology, and government on structuring presentations for high-stakes funding rounds and approvals.