Quick Answer
To start a presentation effectively with executives, lead with your recommendation or key finding in the first sentence — not your agenda, not your name, not context. State what you need them to decide, approve, or know before you say anything else. Then follow with your supporting rationale. This approach respects their time, signals confidence, and keeps them engaged from word one.
In This Article
Valentina had prepared for three weeks. The strategy review was the most important presentation of her year — a proposed restructuring of the European operations division that needed sign-off from the CEO and two board members. She had a strong recommendation, solid data, and a 22-slide deck she’d rebuilt from scratch.
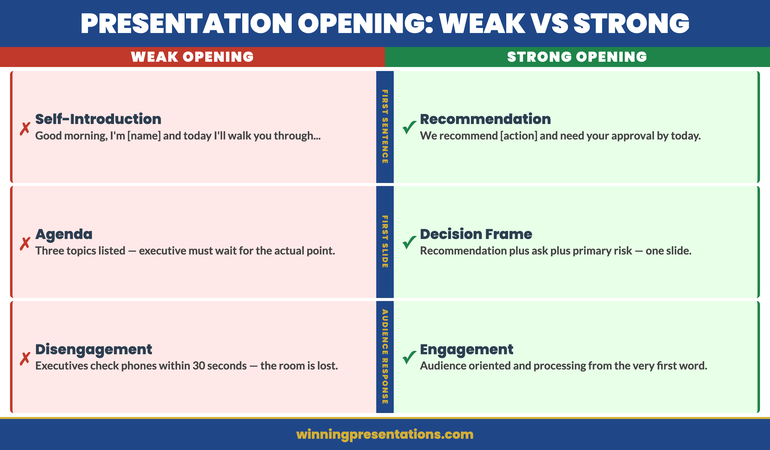
She opened with: “Good morning, everyone. I’m Valentina, Director of Strategy, and today I’m going to walk you through our European operations review, covering the current landscape, our three-year trajectory, and the options we’ve identified.”
The CEO glanced at his phone after eight seconds. One board member poured water. The third opened a different document. Valentina was still on slide one.
It wasn’t the strategy that failed. It was the opening. Three weeks of preparation, and the audience had mentally checked out before the first substantive word.
Presenting to the board or senior leadership this week?
Before you rehearse the deck, check whether your opening passes this test:
- Does your first sentence contain your recommendation or key finding?
- Can someone who arrives 30 seconds late still understand what you’re asking for?
- Have you removed every word of context that comes before the point?
If your opening doesn’t pass all three, the Executive Slide System includes opening slide frameworks built specifically for board and executive settings. Explore the System →
Why the First 30 Seconds Determine Everything
Executive time is genuinely scarce. A CFO chairing a governance committee review may sit through six or seven presentations in a single day. By the time yours begins, their cognitive bandwidth is already stretched. They are not waiting, fresh and curious, to be guided through your thinking. They are looking — consciously or not — for a reason to stop paying close attention.
Your opening either gives them a reason to lean in or confirms it’s safe to disengage. Within 30 seconds, they have formed a working hypothesis about whether this presentation will be worth their full attention. If your opening contains nothing that answers the questions “what does this mean for me?” or “what am I being asked to decide?” — they will drift.
This is not laziness or rudeness. It is rational prioritisation. Understanding that changes everything about how you should structure those first moments.
The presentations that hold executive attention from the first word share one feature: the audience knows what they’re there to do before the presenter moves to slide two. That clarity — delivered in the opening — is the single most powerful structural choice available to you.
It also works for the presenter. When you know that your first sentence contains the recommendation, you eliminate the low-level panic of “are they following this?” because you’ve already given them everything they need to follow it. The rest of the presentation is evidence for something they already know you’re arguing.
The Three Opening Mistakes That Lose Executive Rooms
Most presenters make one of three structural errors at the start. Each one has the same effect: it delays the executive’s understanding of why they are in the room.
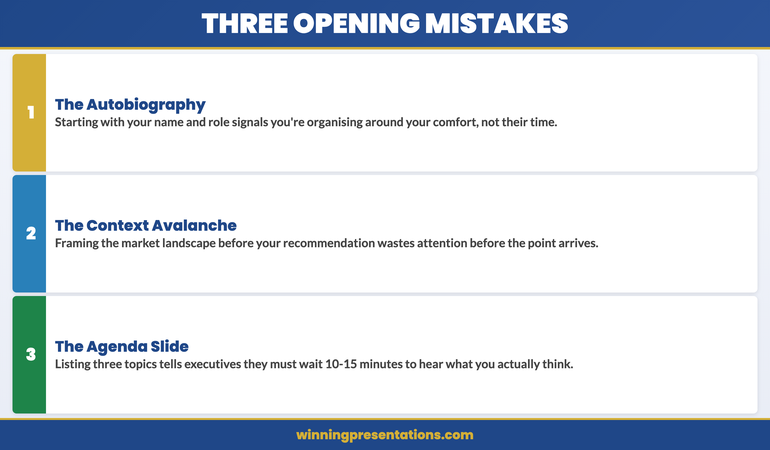
Mistake 1: The autobiography opening. “Good morning, I’m [name], and I’m the Head of [function], and today I’m going to walk you through…” The audience already knows who you are. They approved your invitation to present. Opening with your own name signals that you’re organising the presentation around your own comfort, not their time.
Mistake 2: The context avalanche. Beginning with market background, regulatory landscape, historical performance, or “where we’ve come from” before stating what you’re recommending. Executives live inside this context. They don’t need to be reminded of the environment before they hear your view of it. Start with your view; let context emerge as justification.
Mistake 3: The agenda slide. “Today I’ll cover three areas: the current situation, the options we considered, and our recommendation.” This opening tells executives they will need to wait — often 10 to 15 minutes — before they learn what you think. Most will fill that wait by multitasking. The agenda format is deeply embedded in corporate culture, but it is structurally wrong for executive audiences.
All three mistakes share a root cause: the presenter is building up to the point rather than starting with it. This is natural — it mirrors the way we think through problems. But executives are not there to watch you think. They are there to evaluate your conclusion.
The fix is to invert the structure. Put the conclusion first. Let the thinking follow. See how to structure this in board presentation versus board paper: what executives actually want.
The Opening Framework That Gets Executives to Listen
Stop building up to your point. The Executive Slide System gives you the slide-by-slide structure that places your recommendation first — and keeps executive attention through to the close.
- Opening slide templates for decisions, updates, and approval requests — built for the recommendation-first format
- AI prompt cards to draft your opening sentence and executive summary in under 10 minutes
- Scenario playbooks for board presentations, steering committees, CFO reviews, and project approvals
- Slide-by-slide frameworks showing exact sequence for 12 executive presentation types
Get the Executive Slide System → £39
Designed for executives who need a board-ready opening structure — not generic presentation tips.
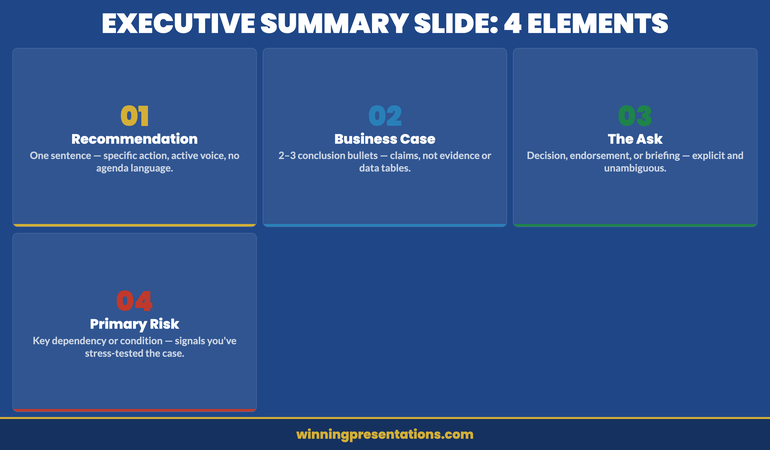
The Recommendation-First Opening Structure
The recommendation-first opening is sometimes called the Pyramid Principle or BLUF (Bottom Line Up Front). The terminology varies, but the principle is consistent: state your conclusion before you build the case for it.
In practice, this means your first spoken sentence — and your first slide — contains the most important thing you need your audience to know or do. Not the most important thing chronologically. The most important thing strategically.
For a decision-seeking presentation, that sentence might be: “We are recommending a consolidation of the Frankfurt and Amsterdam operations, with a target completion date of Q3, and I’m here today to ask for board approval.” For a financial update, it might be: “Revenue is tracking 7% below plan for the quarter, primarily driven by two enterprise contract delays, and I want to walk you through how we’re addressing both.” For a project update, it might be: “Phase one is complete and on budget; phase two has a risk I need to flag before we proceed.”
Notice what each of these openings does: it tells the audience what kind of presentation this is going to be. Decision? Briefing? Risk escalation? They know what role they’re playing — evaluator, recipient of information, risk adjudicator — from the first sentence. That clarity dramatically increases engagement because it gives them a cognitive frame to hang everything else on.
It also demonstrates confidence. Executives who bury their recommendation until the final third of a presentation are often doing so unconsciously out of anxiety — if I build the case first, they’ll have to accept the conclusion. But the effect is the opposite. Executives who can see where a presentation is going are far more patient with the journey. Executives who cannot see where it’s going lose patience with the journey entirely.
For in-depth guidance on structuring the full slide deck around this approach, see presentation pacing and rhythm for executive attention spans.
How to Write Your Opening Sentence
The opening sentence is the hardest sentence in the presentation to write, and the most important one to get right. Most presenters never actually write it down — they just start talking. That is why most presentations begin poorly.
A strong opening sentence for an executive audience needs to contain three elements:
1. What the situation is (one clause). Not a detailed description — a single phrase that locates the audience in the context. “Following the Q1 review…” or “With the procurement timeline now confirmed…” The situation clause should be no longer than the time it takes to say aloud comfortably.
2. What you are recommending or reporting (the main clause). This is the substance of the sentence. “…we are recommending an 18-month partnership with Hargreaves Digital…” or “…the project is tracking to plan with one exception I want to walk you through.” This clause must contain the actual point.
3. What you need from them (the action clause). For decision presentations: “…and I need a decision today to keep the procurement window open.” For updates: “…and I’d welcome your input on the risk-mitigation approach.” For briefings, this clause may be implicit. But for any presentation where a decision or endorsement is being sought, it must be explicit.
Three clauses, one sentence. Write it out before the presentation. Read it aloud. If it runs beyond 25 words, it’s too long. Cut until the point is clear at normal speaking pace. If it sounds awkward, practise it until it doesn’t — the awkwardness is almost always familiarity, not structure.
Crucially: do not start the sentence with “I” or “Today.” Starting with the situation or the recommendation (“Following the strategic review…” or “We are recommending…”) immediately signals to the audience that this is about them and their decision, not about the presenter’s performance.
If you’re building several executive presentations across different scenarios this quarter, the Executive Slide System includes opening slide templates for 12 different executive scenarios — from budget approvals to board strategy reviews — with AI prompt cards to draft the opening sentence for each.
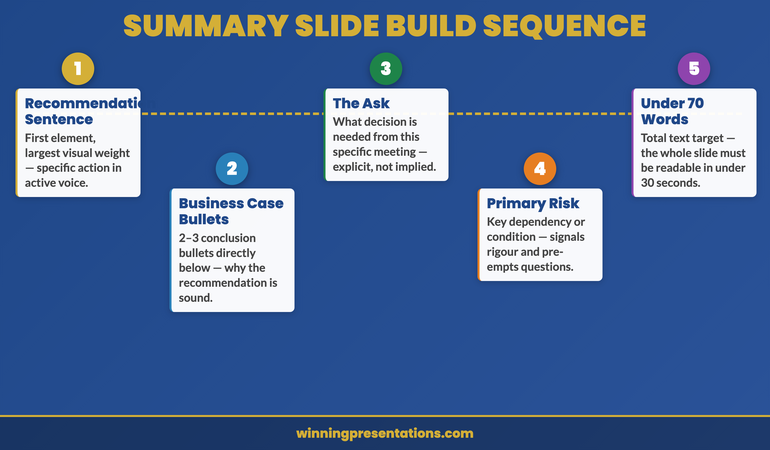
The 60-Second Opening Framework
Once you have your opening sentence, the next 60 seconds of your presentation should follow a consistent structure. This is not a script — it is a sequencing principle.
Seconds 0–15: The opening sentence. State your recommendation, finding, or key message as described above. Pause after you finish. Resist the urge to immediately move forward. That pause — even if it feels long — creates emphasis. It gives the audience a moment to register what you’ve said before you continue.
Seconds 15–30: One sentence of calibration. Immediately after the opening, give the audience a single sentence that tells them what kind of evidence you’re going to share. “I’m going to walk you through the commercial case and the three risks we’ve stress-tested.” Or: “I have five slides — I’d like 12 minutes and then we can open for questions.” This sentence does two things: it sets the audience’s expectations and it signals that you have control of the time. Both reduce resistance.
Seconds 30–50: One sentence of context (if needed). If there is any background the audience genuinely needs to understand the recommendation — and cannot reasonably be assumed to know — this is where it goes. One sentence only. “The context you need: the procurement window closes at end of April, which is why we need a decision today rather than at the May committee.” If no contextual sentence is genuinely necessary, skip this step. Most experienced executives do not need it.
Seconds 50–60: Transition to first evidence point. “So let me start with the commercial case.” “The first thing I want to show you is the risk assessment.” This sentence bridges the opening to the body of the presentation and gives the audience permission to follow you into the detail.
Sixty seconds. Four moves. Opening sentence, calibration, context (optional), transition. If you have delivered those four elements clearly, you have given your executive audience everything they need to engage with everything that follows. The rest of the presentation — however complex — is now being processed through a clear frame.
For board-specific applications of this framework, see presenting to non-executive directors: what changes and what doesn’t.
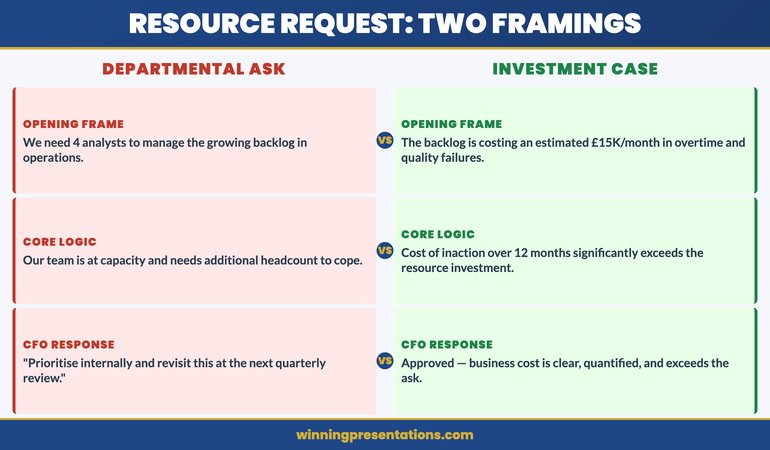
When You’re Presenting Data or Analysis, Not a Decision
The recommendation-first approach is straightforward when you’re asking for approval. But many executive presentations are informational — quarterly updates, risk briefings, market analysis, performance dashboards. There is no single recommendation to lead with. So how does the same principle apply?
The answer: replace “recommendation” with “implication.” Every data presentation has a headline — the most important thing the data says. Your opening sentence should carry that headline, not the data itself.
A performance update that begins with “Revenue is down 3%, operating costs are tracking to plan, and the pipeline is recovering faster than anticipated in two of our four regions” is an executive summary. It has a headline. By contrast, “Today I’m going to walk you through the Q1 performance dashboard” is an agenda. It has no headline.
The discipline here is the same: identify, before you walk into the room, the single most important thing the data is saying. Not the most interesting finding. Not the most surprising outlier. The most important thing from an executive decision-making perspective. Write it down. Lead with it.
This approach also changes what questions you receive. When you open with an agenda, executives often start asking questions before you’ve reached the relevant slide — because they are trying to determine the point. When you open with the headline, questions tend to come at the end, when they have the full picture. This produces better discussion and saves time.
If the data has no clear headline — no dominant implication — that is a signal to revisit the analysis before the presentation, not something to surface in the opening. Arriving in front of an executive team with a data set that doesn’t have a central message is a structural problem in the preparation, not the presentation.
Stop Rebuilding Your Opening from Scratch Every Time
The Executive Slide System includes scenario-specific opening slide templates — for decisions, updates, risk escalations, and financial reviews — so you’re not rewriting the structure for every presentation.
Get the Executive Slide System → £39
Designed for executives presenting at board and senior leadership level across financial services, technology, and professional services.
Frequently Asked Questions
What should the first slide of a presentation to executives look like?
The first slide should contain your recommendation, key finding, or the decision you’re asking for — not your agenda, not a title slide, and not a list of context bullets. The most effective first slide is one where an executive who glances at it for five seconds knows exactly why the presentation is happening and what they are being asked to do. A title plus one sentence is often sufficient.
Is it unprofessional to skip an agenda slide when presenting to senior executives?
Not only is it not unprofessional — for executive audiences, skipping the agenda slide is often the more credible choice. Agenda slides delay the substance of your presentation and signal that you’re structuring around your own comfort rather than the audience’s time. A brief verbal calibration sentence (“I have five slides and I’ll need 12 minutes”) serves the same navigational purpose without slowing the opening. For presentations of fewer than 30 minutes, an agenda slide adds no practical value for an executive audience.
What if I need to give background context before I can state my recommendation?
The question to ask is whether the context is genuinely necessary for the audience to understand the recommendation — or whether it is context you are providing to reassure yourself that you’ve done the groundwork. Most of the time, executives either already know the context or can infer it from the recommendation itself. If specific contextual facts are essential, include one brief calibration sentence before the first evidence slide. Do not spend the first five minutes building context the audience already has.
How long should my presentation opening last?
For executive presentations, the opening — from the first word to the first evidence slide — should take no longer than 60 to 90 seconds. This includes your opening sentence, a calibration phrase, optional context, and a transition to your first point. If your opening is running longer than this, you are building up to your recommendation rather than leading with it. Identify what you’re saving for the end and move it to the start.
The Winning Edge — Weekly Insights for Executive Presenters
Practical frameworks for structuring high-stakes presentations, managing executive audiences, and building decks that get decisions. Delivered every Thursday.
Free resource: Executive Presentation Checklist — the pre-presentation checklist used to prepare board-level presentations across financial services and corporate finance.
About the Author
Mary Beth Hazeldine is the Owner & Managing Director of Winning Presentations. With 24 years of corporate banking experience at JPMorgan Chase, PwC, Royal Bank of Scotland, and Commerzbank, she has delivered high-stakes presentations in boardrooms across three continents.
A qualified clinical hypnotherapist and NLP practitioner, Mary Beth advises executives across financial services, healthcare, technology, and government on structuring presentations for high-stakes funding rounds and approvals.