Quick Answer
A competitive win-back presentation succeeds when it opens by acknowledging why the client left, demonstrates that you’ve addressed the root cause, and presents a forward-looking case that makes the competitor’s offer feel like the interim solution. Structure around accountability first, then transformation, then a specific return path — and never lead with price.
Tomás had been regional sales director at an enterprise software firm for six years. In that time, he’d grown the Northern European book from eleven accounts to twenty-three. But one loss stung more than any win: Valtec, a logistics company that had been a client for four years before switching to a competitor eight months ago.
The procurement lead at Valtec finally agreed to one meeting. Thirty minutes. No guarantees. Tomás spent the first twelve minutes walking through a capabilities deck — new features, improved SLAs, a refreshed pricing model. The procurement lead listened politely, asked one question about implementation timelines, and ended the meeting at minute twenty-two.
Two weeks later, Tomás heard through a mutual contact that Valtec had renewed with the competitor. The procurement lead’s feedback was blunt: “He never once mentioned why we left. It was like it hadn’t happened.”
That single line changed how Tomás approached every recovery conversation from that point forward. The mistake was not in the content of his deck. It was in what he refused to put on the first slide: an honest acknowledgement that Valtec had a reason for leaving, and that the reason mattered.
Preparing for a high-stakes client recovery meeting?
The Executive Slide System includes slide frameworks designed for competitive and client-facing scenarios — structures that help you move from acknowledgement to a credible forward case without losing control of the narrative.
Why most win-back meetings end before they begin
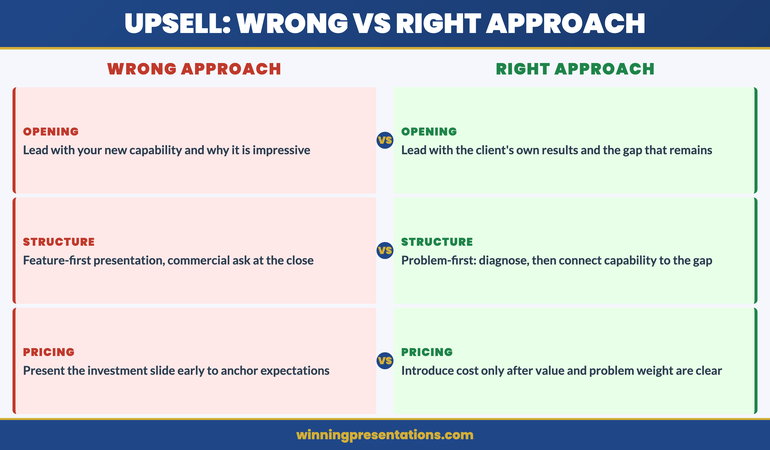
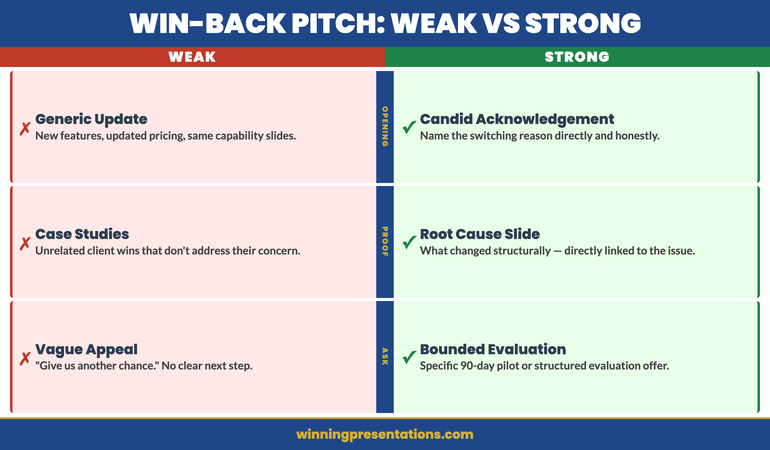
The most common mistake in a competitive win-back presentation is treating it like a new business pitch. It is not. The client already knows you. They chose to leave. That history is the dominant force in the room, and ignoring it signals either a lack of self-awareness or, worse, indifference to their experience.
When a client has moved to a competitor, the psychological dynamic shifts in three ways that most sales teams underestimate:
Switching cost creates defensiveness. The client has already invested time, budget, and political capital in moving to a new provider. They need the switch to have been the right decision. Your presence in the room threatens that narrative. If your presentation doesn’t acknowledge this, the client spends the entire meeting defending their choice rather than evaluating yours.
Trust deficit is the real barrier. Price, features, and SLAs are the stated reasons for departure. But the deeper issue is almost always a breakdown in trust — unmet expectations, poor communication during a critical period, or a feeling that the relationship was being taken for granted. A capabilities presentation doesn’t address trust. Only accountability does.
The competitor is now the default. Before the switch, you were the incumbent with all the advantages of inertia. Now the competitor holds that position. You are the challenger, and challengers must offer a reason to change that is materially stronger than the reason to stay. “We’ve improved” is not strong enough. “Here is what we got wrong, what we changed, and what the next twelve months would look like” begins to be.
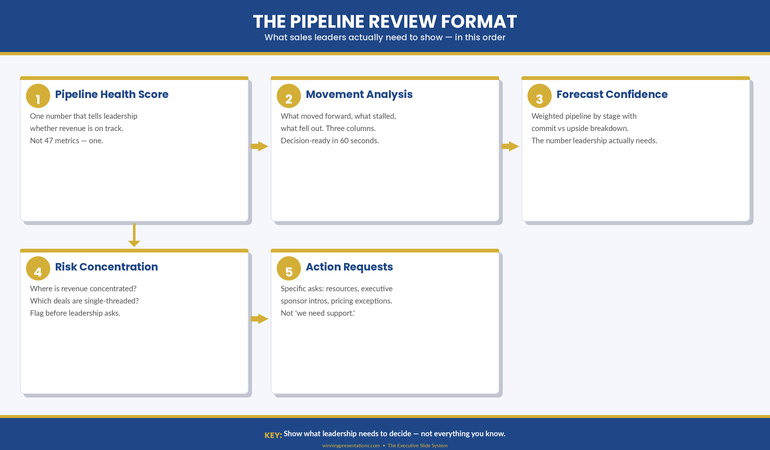
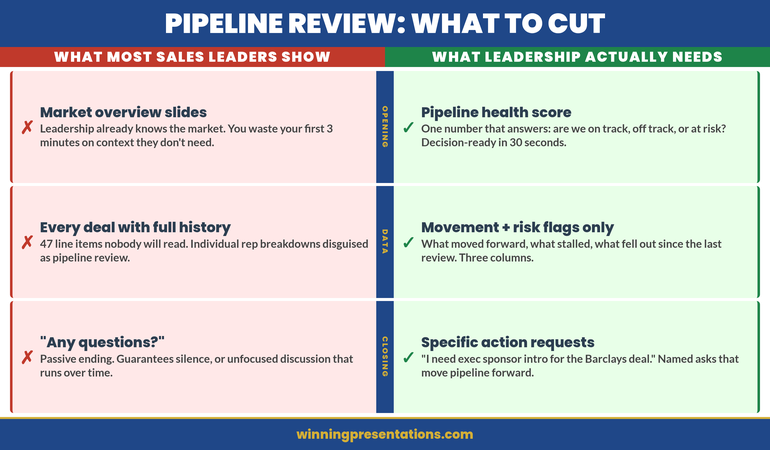
Understanding these dynamics before you build a single slide is what separates a win-back meeting that opens a door from one that confirms the client’s decision to leave. For a broader view of how pipeline-critical presentations should be structured for maximum impact, see the guide to pipeline review presentations for sales leaders.
Structure Your Win-Back Deck in Under 30 Minutes
The Executive Slide System — £39, instant access — gives you slide frameworks for competitive scenarios, client recovery meetings, and high-stakes sales presentations. Stop building from blank slides when the meeting is tomorrow morning.
- 22 templates covering sales, client, and executive presentation scenarios
- 51 AI prompts for drafting slides, talking points, and briefing notes
- 15 scenario playbooks including competitive and client-facing meetings
Get the Executive Slide System →
Designed for high-stakes client recovery meetings.
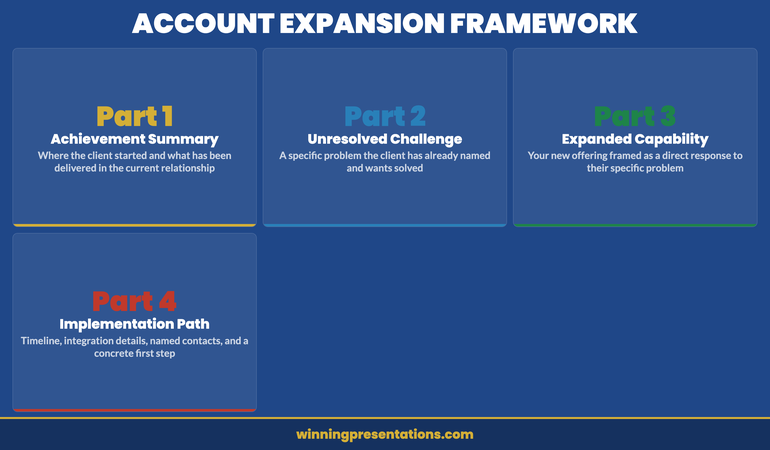
The accountability opening: leading with what went wrong
The first ninety seconds of a win-back meeting determine whether the client listens to the remaining twenty-eight minutes. And the only opening that reliably earns that attention is accountability.
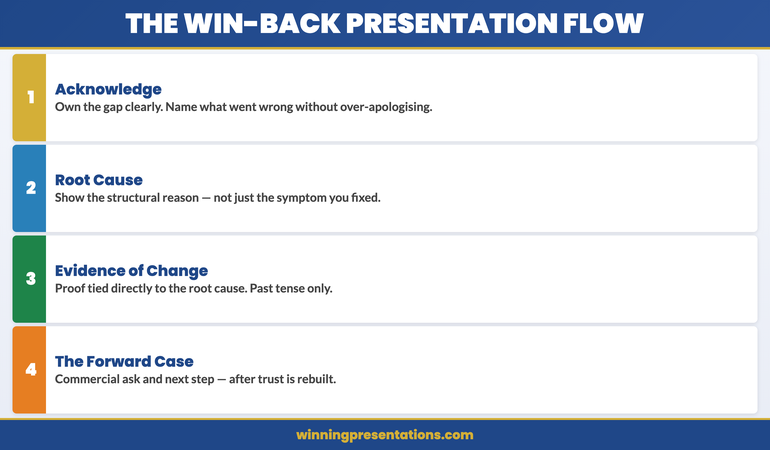
This does not mean a long apology. It means a concise, specific acknowledgement that demonstrates you understand exactly why the relationship ended. The structure is straightforward:
Name the issue. “When you moved your account to [competitor] eight months ago, the primary driver was [specific issue]. We understand that.” One sentence. No hedging, no qualifiers, no passive voice.
Own the responsibility. “That happened because [specific internal cause]. It was within our control, and we didn’t manage it well enough.” This is the sentence most sales professionals cannot bring themselves to say. It is also the sentence that shifts the dynamic from defence to dialogue.
State the change. “Since then, we’ve [specific action taken]. Here’s the evidence.” Not a promise — evidence. A new process, a new team member, a structural change in how accounts of this size are managed. Something the client can verify independently.
This three-part opening typically takes sixty to ninety seconds. It costs nothing except ego. And it accomplishes what no feature comparison or pricing concession can: it tells the client you were paying attention when they left, and that their departure changed something real.
The temptation to skip the accountability opening is enormous. The internal voice says, “Let’s focus on the future, not the past.” But the client is already focused on the past. They are sitting across the table replaying every frustration that led to the switch. If you don’t address it, they will — and you will lose control of the conversation at the worst possible moment.
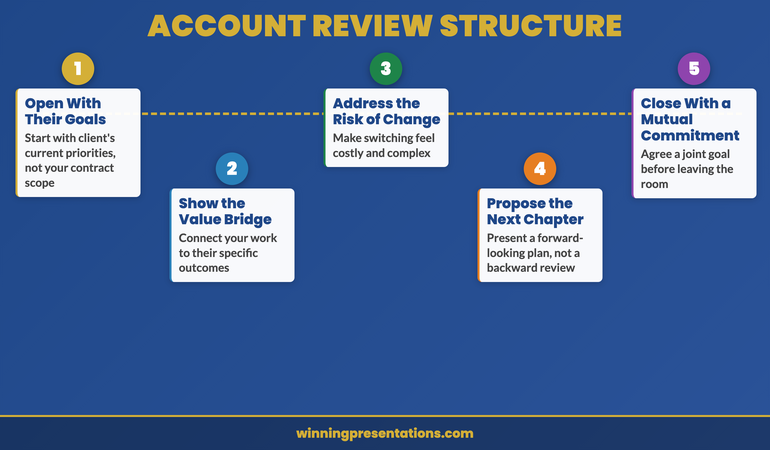
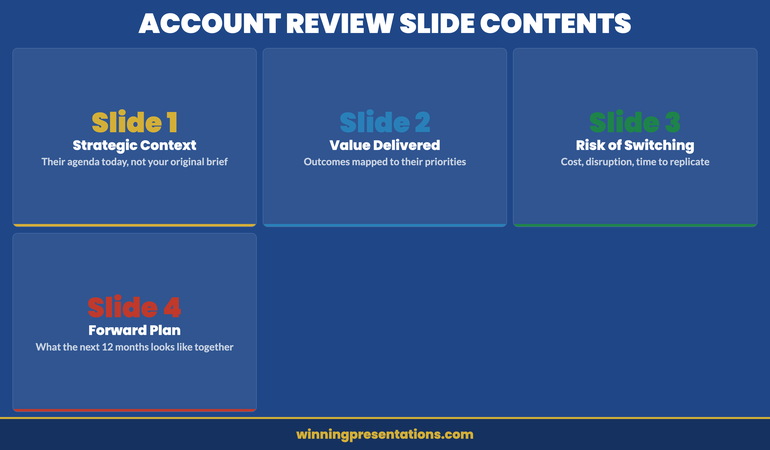
Building the transformation narrative
Once accountability is established, the presentation shifts to what has changed. This is not a product update or a feature release summary. It is a transformation narrative — a structured argument that connects the client’s reason for leaving to a specific, verifiable change in how you operate.
The transformation narrative has three components:
The root cause analysis. Go deeper than the surface complaint. If the client left because of slow response times, the transformation narrative doesn’t start with “We’ve hired more support staff.” It starts with “We analysed our response time data and found that escalation routing was adding an average of four hours to critical tickets. We restructured the escalation path.” The client needs to see that you understood the mechanism, not just the symptom.
The structural change. What have you actually done differently? Not what you plan to do — what you have done. New processes, new team structures, new technology, new governance. The more specific and verifiable, the more credible. “We’ve improved our service” means nothing. “We moved to a dedicated account team model for enterprise clients, with a named technical lead and a quarterly business review cadence” means something.
The evidence. If you’ve made changes, you should have data. Response times, satisfaction scores from current clients in a similar segment, retention rates since the change was implemented. Present these not as marketing claims but as operational metrics. The client will assess them with the same rigour they’d apply to any vendor evaluation — because that is exactly what this meeting is.
The transformation narrative works because it answers the client’s unspoken question: “If I come back, will the same thing happen again?” Features and pricing cannot answer that question. Only evidence of structural change can.
This approach mirrors the discipline required in any client-facing presentation where trust must be rebuilt. The principles of structuring a credible forward case apply equally when presenting a contract renewal presentation, where the stakes of losing continuity are just as high.
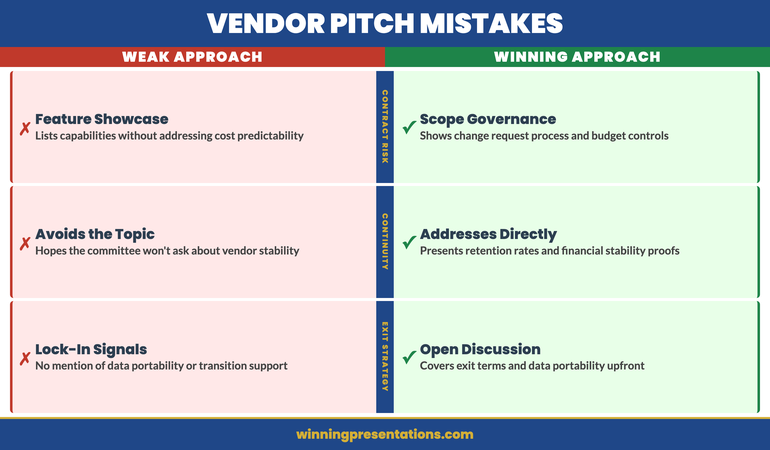
Reframing the competitor without attacking them
In a win-back scenario, the competitor is the elephant in the room. The client is currently working with them. Any direct criticism of the competitor will be heard as an attack on the client’s judgement — because the client chose them.
The strategic approach is reframing, not attacking. Three techniques work consistently:
Acknowledge what the competitor does well. This is counterintuitive but powerful. “We understand that [competitor] brought [specific capability] to the table, and that was an important factor in your decision.” This signals confidence and maturity. It tells the client you’re not threatened, and it earns permission to make your own case.
Identify the gap without naming it as a weakness. Instead of saying “Their platform can’t handle your scale,” try “As your operations have grown over the past eight months, you may have noticed areas where a different approach to [specific function] could add value.” Let the client connect the dots. They know their own pain points better than you do, and they’ll trust their own conclusions more than your accusations.
Position yourself as the next step, not the replacement. The framing that works is evolution, not reversal. “Your move to [competitor] solved [problem A]. The question now is whether the next phase of your growth requires [capability B], which is where our approach differs.” This positions the competitor as a legitimate chapter in the client’s journey, and you as the next one.
If you’re preparing for a competitive win-back meeting and want a structured framework rather than building slides from scratch, the Executive Slide System includes scenario playbooks designed for exactly this type of high-stakes client conversation.
The temptation to undermine the competitor is strongest when you know they’re delivering a weaker service. Resist it. The client chose them for a reason, and dismissing that reason dismisses the client’s intelligence. Win the argument on the strength of your forward case, not the weakness of their current provider. The same principle of positioning against alternatives without undermining the audience’s judgement applies when structuring a vendor selection presentation.
Structuring the return path: making it easy to say yes
The final section of your win-back deck must answer the practical question: “If I wanted to come back, what would that actually look like?”
Most win-back presentations fail at this stage because they end with a vague “We’d love to discuss next steps.” The client has already taken a risk by agreeing to the meeting. If you can’t show them a concrete, low-friction path to returning, you’ve wasted both your time and theirs.
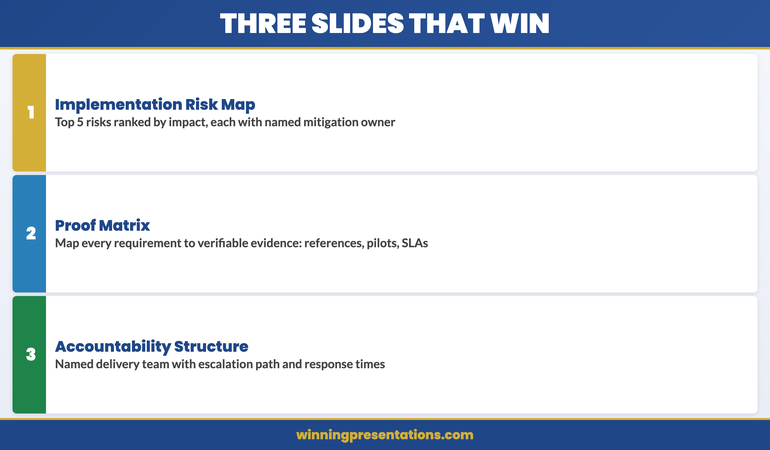
The return path should address four elements:
Transition logistics. How would the move back work? What’s the timeline? What resources would the client need to commit? If the answer is “We’ll work that out later,” the client will default to the path of least resistance — which is staying where they are. Map the transition in enough detail that the client can see it is manageable.
Risk mitigation. What happens if the return doesn’t go smoothly? Offer specific commitments: a dedicated transition manager, a defined escalation path during the first ninety days, or a performance review at the three-month mark. These are not concessions — they are signals that you take the client’s risk as seriously as they do.
Commercial terms. Be direct about pricing but do not lead with a discount. A discount-led win-back says “We’ll charge you less because we know we’re not worth full price.” Instead, present pricing in the context of value: “Here is what the engagement looks like, here is the investment, and here is how it compares to what you were paying before you left.” If commercial terms have genuinely improved, present that as a market evolution, not a desperation gesture.
The specific ask. End with a clear, concrete next step. Not “Let’s schedule a follow-up” but “We’d like to propose a two-week pilot on [specific workstream] starting [date]. No contract commitment required until you’ve seen the results.” A low-commitment entry point reduces the client’s switching anxiety and gives them something to say yes to without betting the entire relationship on one meeting.
Walk Into the Win-Back Meeting With a Structure That Works
The Executive Slide System — £39, instant access — gives you repeatable slide structures for competitive presentations, client recovery meetings, and account reviews. 22 templates, 51 AI prompts, 15 scenario playbooks. Build your deck with confidence, not guesswork.
Get the Executive Slide System →
Designed for competitive and client-facing presentation scenarios.
What to do the morning of the meeting
The preparation for a win-back meeting doesn’t end when the slides are finished. The morning of the meeting matters more than most sales professionals realise, because the psychological readiness of the presenter shapes the tone of the entire conversation.
Three preparation steps are worth the time:
Re-read the client’s departure communication. Whatever email, call notes, or internal summary captured why they left — read it again the morning of the meeting. This grounds you in their perspective, not yours. It prevents the natural drift toward optimism and features that happens when you’ve been building slides for days.
Rehearse the accountability opening out loud. The first ninety seconds are the hardest. Saying “We got this wrong” is uncomfortable, and discomfort creates hesitation. Rehearse the opening three times, out loud, until it sounds natural rather than scripted. The client will hear the difference between genuine accountability and a rehearsed performance — but genuine accountability still requires rehearsal.
Identify the one question you’re most afraid of. Every win-back meeting has a question the presenter hopes won’t come up. Maybe it’s about a specific incident. Maybe it’s about a person who no longer works for your organisation. Maybe it’s about a promise that was broken. Identify that question, prepare an honest answer, and accept that it will probably be asked. When it is, your preparedness will read as integrity. For a more detailed framework on morning preparation for any high-stakes presentation, see the guide on morning protocol for presentation day.
The difference between a win-back meeting that reopens a relationship and one that confirms its end often comes down to these small acts of preparation. The slides matter. The structure matters. But the presenter’s willingness to be honest, direct, and accountable in the first two minutes matters more.
Frequently Asked Questions
How long should a competitive win-back presentation be?
Keep it between eight and twelve slides, designed for a twenty to thirty-minute meeting. The accountability opening takes one to two slides. The transformation narrative takes two to three. The competitive reframing takes one to two. The return path takes two to three. Reserve at least a third of the meeting time for discussion — the client’s questions and concerns are where the real decision-making happens, not during your presentation. If you’ve been given thirty minutes, plan fifteen minutes of slides and fifteen minutes of conversation.
Should I mention the competitor by name in my presentation?
Use the competitor’s name sparingly and only when acknowledging the client’s choice. A line such as “Your decision to work with [competitor] was driven by [reason], and we understand that” is appropriate. What you should avoid is a side-by-side comparison slide that positions the competitor negatively. The client chose them. Attacking the competitor feels like attacking the client’s judgement. Instead, focus on what has changed on your side and what the client’s next phase of growth requires. Let the client draw their own comparisons.
What if the client says they are happy with their current provider?
Accept it gracefully and shift the conversation to the future. “I’m glad the transition has gone well. We’re not here to suggest it hasn’t. We’re here because your business has changed in the last eight months, and some of those changes may create requirements that a different approach could serve better.” This reframes the meeting from win-back to forward planning. If the client genuinely has no pain with their current provider, no amount of persuasion will change that in one meeting — but leaving the door open with professionalism means you’ll be the first call when something does change.
The Winning Edge
Weekly strategies for executives who present in competitive, high-stakes client meetings. Every Thursday.
Want a quick-reference checklist before your next client meeting? Download the free Executive Presentation Checklist — a single-page structure guide for any high-stakes presentation.
For executives facing a different kind of high-stakes boardroom scenario — one where crisis communication and transparency are paramount — the dynamics differ but the principle of leading with honesty applies equally. See the related guide on data breach board presentations.
Your next win-back meeting should open with accountability, build through evidence of change, and close with a specific, low-friction return path. Prepare the slides, rehearse the opening, and walk in ready to be honest about what went wrong. The client already knows. The question is whether you do.
About the Author
Mary Beth Hazeldine is the Owner & Managing Director of Winning Presentations. With 25 years of corporate banking experience at JPMorgan Chase, PwC, Royal Bank of Scotland, and Commerzbank, she advises executives across financial services, healthcare, technology, and government on structuring presentations for high-stakes client meetings, competitive pitches, and account recovery scenarios.