
Management Accounts Presentation: When the Numbers Demand an Explanation
Quick Answer: A management accounts presentation fails when it reports numbers without explaining them. The board already has the figures — what they need from you is the narrative: what changed, why it changed, and what management is doing in response. The most effective management accounts presentations are built around a four-part structure for each key metric: expectation, outcome, cause, response. That structure turns a reporting exercise into a decision-making conversation.
Astrid had been Head of Finance at the logistics company for four years. She was methodical, precise, and trusted by the board. But the month the EBITDA came in 23% below budget, she sat in front of her spreadsheet for three hours wondering how to build a management accounts presentation that would not lose her credibility before she finished the first slide.
The temptation was to bury the number — to lead with revenue (which was only 8% down), build the case for external factors, and let EBITDA appear deep enough in the deck that the meeting had momentum before the board saw it. She resisted that instinct. Instead, she put the key variance on the second slide, led with the most honest explanation she had, and structured the rest of the presentation around what management was doing to recover the position.
The board did not respond well to the EBITDA figure. But they responded well to her. The Chair said afterwards that the most confidence-inspiring thing a finance director can do is present bad news clearly, early, and with a plan. Boards are experienced enough to know that businesses have difficult months. What they are actually assessing is whether management understands its own numbers and is in command of its own response.
That distinction — between what the numbers say and whether management understands them — is what the management accounts presentation is really designed to communicate.
If you present financial results to a board or senior committee
The Executive Slide System includes slide templates and framework guides designed for finance and board reporting presentations — including the narrative structure that turns monthly accounts from a reporting exercise into a conversation that drives decisions.
Why Management Accounts Presentations Go Wrong Before a Slide Is Built
The most common failure in management accounts presentations is not a presentation problem. It is a framing problem — and it happens before anyone opens PowerPoint.
When finance teams approach the monthly pack as a reporting exercise, the output is a presentation that describes what happened. When they approach it as a communication exercise, the output is a presentation that explains what happened and what it means for decisions being made right now. These are structurally different outputs, and boards experience them as such. One feels like a status update. The other feels like the briefing they needed to walk in and make a call.
The second common failure is building the presentation around the structure of the accounts rather than the structure of the conversation the board needs to have. Management accounts are organised by accounting categories: P&L, balance sheet, cash flow, departmental cost centres. Boards are not organised by accounting categories — they are organised by decisions, priorities, and concerns. Presenting in accounting order forces the board to do the interpretive work of connecting figures to implications. Presenting in decision order means the slides do that work for them.
A third failure is proportionality. Finance teams with 40 slides of management accounts are not communicating more effectively than those with 12. They are signalling that they have not prioritised — that every number is equally important, which means none of them are. The board will come to its own conclusions about which three figures matter most, and those conclusions may not align with yours. The management accounts presentation is your opportunity to make that prioritisation explicit. The principles behind this are covered in depth in the data presentations for executives framework — the same logic applies here.
Executive Slide System
Build Financial Presentations That Drive Decisions, Not Just Discussion
The Executive Slide System — £39, instant access — includes slide templates for finance and board reporting presentations, AI prompt cards for structuring your financial narrative, and framework guides for presenting variance analysis and results with clarity. Designed for finance directors and senior executives who present management accounts to boards and senior committees.
- Slide templates for management accounts, board updates, and financial review presentations
- AI prompt cards to build your narrative around key variances and performance drivers
- Framework guides for structuring financial results as a decision-making conversation
- Scenario playbooks for presenting unfavourable results and recovery plans to senior audiences
Get the Executive Slide System →
Designed for executives presenting financial results in high-stakes board environments.
The Narrative Architecture for Financial Results
Every management accounts presentation needs a narrative architecture — a conscious decision about what story you are telling with the numbers, before you decide which numbers to show.
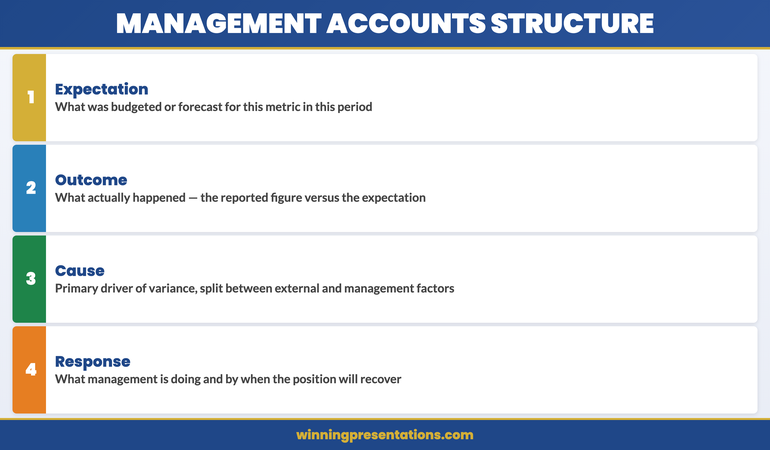
The most reliable structure for financial results uses a four-part sequence for each key metric: expectation, outcome, cause, response. Expectation: what was the budget or forecast? Outcome: what actually happened? Cause: what was the primary driver of the difference? Response: what is management doing about it, and on what timeline? Applied consistently across your three or four priority metrics, this structure gives the board everything it needs to form a view and ask the right questions — without requiring them to read across multiple slides to piece together a picture you could have given them in one.
One structural decision that significantly improves management accounts presentations is the choice to lead with the conclusion rather than build to it. Most finance presentations work chronologically or logically: here are the inputs, here is the process, here is the output. Boards find this frustrating because they want to know the headline before they invest attention in the detail. Leading with the conclusion — “EBITDA is 23% below budget, driven primarily by two factors, and here is our recovery plan” — orients the board before you present the evidence. It does not reduce the rigour of the presentation; it increases the board’s ability to engage with it productively.
Cross-referencing your management accounts narrative against the quarterly forecast gives the board an additional layer of context — whether the monthly variance is part of a pattern or an isolated month. The quarterly forecast presentation framework covers how to integrate this context without doubling the length of your pack.
Variance Analysis: How to Present the Gap Without Sounding Defensive
Variance analysis is where most management accounts presentations either gain or lose the board’s confidence. The numbers themselves rarely cause the problem. The way they are explained does.
The defensive presentation of variance explains the gap in terms of factors outside management’s control. Fuel costs increased. Currency moved against us. The market contracted. These may all be true — but presenting them without equal weight on what management controlled creates the impression that the team sees itself as a passive responder to external conditions. Boards lose confidence in finance leaders who consistently attribute outcomes to factors they could not influence.
The credible presentation of variance separates causes into two categories: external factors (outside management’s control) and management decisions (inside management’s control). For each, it gives the honest weighting. If 60% of the EBITDA shortfall came from a supplier cost increase and 40% from a decision to prioritise volume over margin in Q3, both get stated clearly. The 40% that management controlled is where the board will focus — and presenting it voluntarily, with context, is far stronger than having the board extract it through questions.
The response section of the variance narrative is where credibility is built or destroyed. A vague response (“we are reviewing our cost structure”) signals that management does not yet have a clear plan. A specific response (“we have identified three cost reduction levers that will recover 60% of the shortfall by month eight, and we are tracking them against weekly milestones”) signals that management is in command of its own situation. Specificity — even when the situation is difficult — is more confidence-inspiring than optimism. For more on how variance analysis integrates into board financial reporting, the budget variance presentation framework is a useful companion resource.
For finance directors and heads of strategy who present management accounts to boards and senior committees, the Executive Slide System includes slide templates and AI prompt cards designed specifically for financial results and board reporting presentations.

The One Slide Your Board Reads First
Every management accounts pack has one slide that the board will turn to before the presentation formally begins. In most cases, it is the summary P&L or the KPI dashboard on the first or second page of the pack. Boards have learned to navigate to this slide first because it gives them the headline picture before they invest attention in anything else.
Because this slide receives disproportionate attention, it deserves disproportionate care. The summary slide — whether it is a P&L summary, a KPI dashboard, or an executive briefing note at the front of the pack — should give the board the three things they most need to know: the headline financial position against budget or prior year, the one or two primary drivers of any significant variance, and the management response or action being taken. One slide. Three pieces of information. Nothing that requires them to cross-reference page 14 to understand what they are looking at.
The formatting of this slide matters more than any other in the pack. Red/amber/green traffic light indicators work well for KPIs where the direction of movement is self-evident — but they lose their value if overused. If everything is amber, nothing is. Reserve the RAG system for your five or six most critical metrics, and let the narrative explain everything else. A board that has to decode a slide before it can read it is a board whose attention you have already lost.
When the Numbers Tell a Story the Business Doesn’t Like
There is a version of management accounts preparation that every finance director and CFO knows well: you have the figures, they are worse than expected, and you have to build a presentation that explains them to people who will be concerned, possibly critical, and are relying on you to give them an honest picture.
The principle that holds in this situation is simpler than most executives expect. Boards deal with bad news regularly. What they cannot deal with is bad news that arrives late, that arrives without explanation, or that arrives with an explanation that subsequently turns out to be incomplete. The finance director who tells the board the full picture clearly and early — and who has a credible plan — is in a far stronger position than the one who presents an optimistic version that requires three subsequent months of “further explanation.”
When presenting unfavourable management accounts, lead with the headline. Do not bury it. State what has happened, why it has happened (with honest weighting between external and management factors), and what management is doing about it. The board will have questions — that is appropriate. Your job is to ensure that your answers to those questions do not produce a worse impression than the numbers themselves. Preparation here is everything: anticipate the three or four questions the board is most likely to ask, have precise answers ready, and resist the temptation to speculate on outcomes you cannot yet project with confidence.
One phrase that finance directors find useful when presenting difficult results: “Here is what we know, here is what we do not yet know, and here is what we are doing to find out.” It is honest, it is structured, and it signals a management team that is running towards a problem rather than away from it. The same principle — leading with clarity rather than protection — applies in investor and shareholder contexts; the AGM presentation framework for handling shareholder questions applies the identical logic to the public scrutiny that listed company finance directors face.
Making Management Accounts a Decision Tool, Not a Report
The highest-value management accounts presentations do something most finance presentations do not: they end with a clear indication of what the board needs to decide or approve as a result of what has been presented.
Most management accounts presentations are constructed as information deliveries — here are the facts, over to you. The board then has to do the interpretive work of converting information into decision points. Some boards are good at this. Many are not, or take significantly longer than necessary because the finance team has not made the decision implications explicit.
A simple addition to the closing section of any management accounts presentation is a “decisions required” or “board input needed” slide that states clearly: given what we have just presented, here are the two or three things we need from you before the next management accounts meeting. These might be approval for additional budget, endorsement of a cost recovery plan, or a steer on strategic priorities in light of a changed financial position. The specificity of this slide tells the board exactly what you need them to do — and gives the finance team a clear mandate to act on after the meeting.
This approach transforms management accounts from a reporting exercise into a governance mechanism. The board is not just receiving information — it is actively participating in the response to that information. Finance directors who build this habit find that their board relationships improve significantly, because the board begins to see the management accounts meeting as a forum where real decisions get made, not just a status update that could have been an email.
Executive Slide System
The Slide Architecture for Finance Leaders Who Present to Boards
The Executive Slide System — £39, instant access — includes slide templates for management accounts and board financial reporting, AI prompt cards for building variance narratives, and framework guides for structuring results presentations that drive decisions rather than just discussion.
Get the Executive Slide System →
Designed for finance directors and senior executives presenting results to boards and senior committees.
Frequently Asked Questions
How should management accounts be presented to a board?
Management accounts should be presented to a board in decision order, not accounting order. Rather than working through the P&L line by line, identify the three or four metrics that most directly affect the decisions the board will make in the next quarter — and build your narrative around those. For each key metric, use the expectation-outcome-cause-response structure: what was forecast, what happened, why, and what management is doing about it. Lead with the headline rather than building to it, and close with a clear statement of what you need from the board. The pack itself should be concise — a well-constructed 12-slide management accounts presentation is more effective than a 40-slide one that forces the board to do the interpretive work.
What do you do when management accounts are significantly below budget?
When management accounts are significantly below budget, the presentation approach matters as much as the content. Lead with the headline variance early — do not bury it in the middle of the pack. Present the causes with honest weighting: separate the factors outside management’s control from the decisions management made that contributed to the shortfall. The board will focus on the controllable element, so present that part with a specific recovery plan and timeline rather than a vague commitment to “review the situation.” The finance director who presents difficult numbers clearly, early, and with a credible plan is in a far stronger position than one who presents optimistically and has to revise downwards again next month.
How many slides should a management accounts presentation have?
For a typical board management accounts presentation, 10 to 15 slides is generally appropriate. This allows for an executive summary slide, three to five slides covering key financial metrics with variance analysis, one to two slides on operational performance, a slide on cash and balance sheet position if relevant, a forward-looking section covering the updated forecast or outlook, and a decisions-required slide at the end. Anything significantly beyond 15 slides tends to dilute rather than enhance the board’s understanding — it signals that the finance team has not done the prioritisation work that the board is relying on them to do.
The Winning Edge
Weekly insights on executive presentations, delivered every Thursday. Practical frameworks, real scenarios, and honest analysis of what actually works in senior boardrooms.
Free resource: Download the Executive Presentation Checklist — a one-page pre-presentation review for board and senior committee presentations.
About the Author
Mary Beth Hazeldine — Owner & Managing Director, Winning Presentations
With 25 years of corporate banking experience at JPMorgan Chase, PwC, Royal Bank of Scotland, and Commerzbank, Mary Beth Hazeldine advises executives across financial services, healthcare, technology, and government on structuring presentations for high-stakes funding rounds and approvals. She works directly with senior leaders to build the presentation architecture that gets decisions made. Learn more at Winning Presentations.