
Business Storytelling for Executive Presentations: Why Narrative Beats Bullet Points in Every Metric
Quick answer: Business storytelling for executive presentations works because senior committees process compressed narrative faster than stacked bullets. The four-part structural move — Setup, Stakes, Shift, Stake-out — turns the metrics in your deck into a decision the room can weigh. Bullet-stacked decks lose senior attention by minute seven. Narrative-led decks land because the brain reads story as a request to choose, not as a list to absorb. The structural test is whether each slide is doing narrative work, or just listing.
JUMP TO:
Priya, a strategy lead at a mid-sized fintech, walked into the executive committee with thirty-one slides and a recommendation to retire one of the firm’s two card-issuing platforms. The deck opened with a market context section — six slides on regulatory trends, competitor consolidation, and customer churn benchmarks. Eight slides followed on the technical architecture of the two platforms. Eleven slides set out the migration analysis, cost modelling, and risk register. The last six slides held the recommendation and the financial case for it.
By slide nine the chair was checking his watch. By slide eighteen two committee members were typing on phones. At slide twenty-four the CFO interrupted with a question about a number on slide eleven that Priya had moved past twelve minutes earlier. She lost five minutes finding the slide. The committee never recovered the thread. The session ended with a polite “thank you, send us the materials” — which everyone in the room understood as deferral.
Two weeks later, Priya walked back in with eight slides. The first slide was a single sentence: the firm was carrying two platforms doing one job, and customer acquisition was being throttled by the older system at a rate the new platform did not have. The next slide named what was at risk if nothing changed. The third slide named the move. The fourth slide showed what changed at yes versus what changed at no. By slide six the committee was asking decision questions. The recommendation was approved before slide eight. The data had not changed. The narrative around it had.
If you want a structured approach to turning data into narrative for senior committees:
The Business Storytelling Mini-Course covers the structural moves senior leaders use to turn data into stories committees back. Self-paced, designed for the executive scenarios where bullets fail and narrative lands.
Why bullets fail for senior decision audiences
Bullet points are an artefact of how presentation decks are written, not how senior audiences process information. A bullet list invites the reader to scan, weigh each item against the others, and form a composite view. That is a fine cognitive task for an analyst reviewing a memo at their desk. It is the wrong task for an executive committee with thirty minutes, four other items on the agenda, and a recommendation to evaluate. The committee is not at their desk. They are in the room. They process spoken language and one focal idea at a time.
The second reason bullets fail is that they hide the request. A four-bullet slide presents four ideas of equal visual weight. The committee has to work out which one matters most, which one supports which, and which one the presenter is actually arguing. Senior audiences do this work for two or three slides, then disengage. The deck has asked them to do the leader’s structural job. The leader’s structural job is to make the request unmistakable. Bullets diffuse the request across the slide.
The third failure pattern is timing. Decks built around bullets tend to run long, because each bullet feels load-bearing and none get cut. The leader walks into the room with twenty-five slides, talks for twenty-eight minutes, and leaves the committee with two minutes to decide. Senior committees who feel rushed default to deferral. A narrative-led deck cuts the slide count to eight or ten and hands the committee the time they need to weigh the request. For a deeper treatment of the underlying mechanic, see our companion guide on storytelling for business presentations.
The four-part business storytelling framework
The framework that consistently works for executive data presentations has four moves: Setup, Stakes, Shift, Stake-out. It is structural rather than theatrical. It does not require the leader to perform. It requires the leader to compress the analysis the team has done into the four shapes the committee actually needs to weigh a decision.
Setup is the situation the data describes — in one sentence. Not a market context section. Not a recap of the last two years of operating performance. The single sentence that names the operational reality the rest of the presentation rests on. “Customer acquisition is being throttled by the older platform at a rate the newer one is not.” That is a Setup. The committee now has the frame for everything that follows.
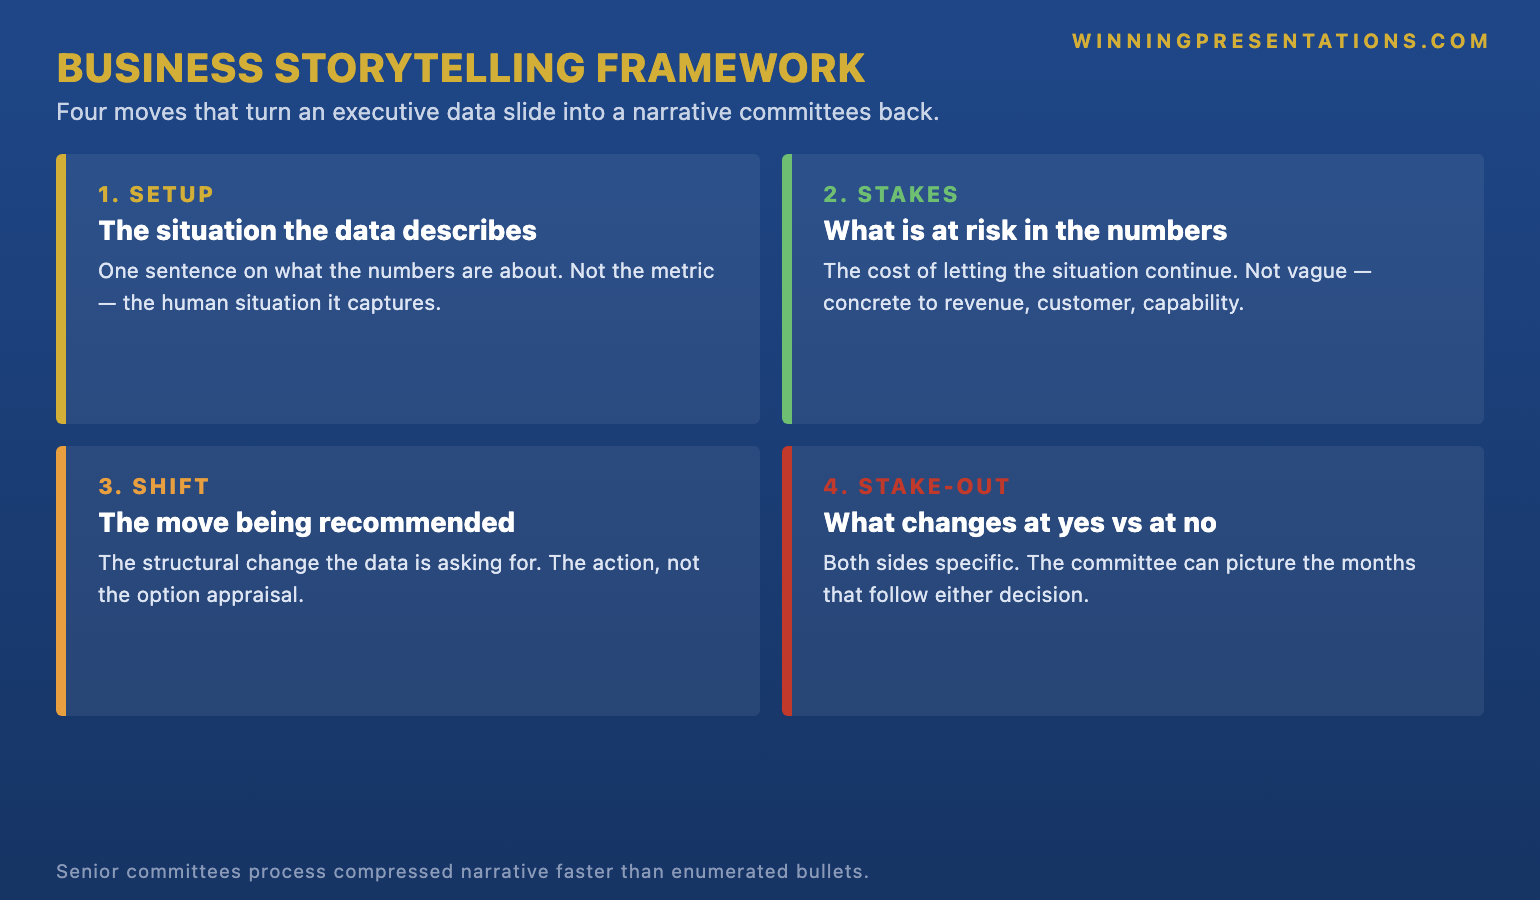
Stakes name what is at risk if the situation persists. Stakes are not threats. They are the honest cost of doing nothing — expressed in the language the committee already uses to evaluate risk. “If nothing changes, we forecast losing 14 per cent of new acquisition by Q4 and forfeiting the platform-rationalisation budget set aside for this year.” Stakes give the committee a reason to engage with the rest of the deck. Without stakes, the data feels academic — interesting to the team that built it, optional for the committee weighing it.
Shift is the move being recommended, named in one sentence. “Retire the older platform on an 11-month timeline and consolidate acquisition on the newer one.” Shift is where most decks already do reasonable work — but they bury the Shift on slide eighteen instead of putting it on slide three. Compressing the Shift into a single sentence and surfacing it early is the move that re-orders the room from “we are watching a presentation” into “we are weighing a request”.
Stake-out closes the narrative by pairing two short statements: what changes at yes, and what changes at no. The “at yes” line tells the committee what they are buying. The “at no” line tells them what they are choosing instead. Honest “at no” lines — not catastrophised, not euphemised — are what give the committee permission to back the request. They have weighed both sides. They are choosing one. For a related treatment in the strategy context, see the five-year strategy presentation narrative arc.
Turn numbers into stories that move executive decisions.
The Business Storytelling Mini-Course is a self-paced programme covering the structural moves senior leaders use to turn data into stories committees back. Frameworks for narrative structure around executive data, without sounding like a TED Talk pastiche. £29, instant access, no subscription.
- Frameworks for narrative structure around executive data — designed for the moments where bullets fail
- Self-paced, designed to be worked through in the days before a senior committee meeting
- Designed for senior professionals presenting data-led recommendations to executive audiences
- Instant access on purchase, no subscription, no recurring billing
Turning a metric into a narrative anchor
The most common failure in data-led executive presentations is that the metric and the narrative are running on parallel tracks. The slide shows a chart. The leader talks around it. The committee tries to map the talking back onto the chart, fails halfway through, and disengages. The fix is to use the metric itself as the narrative anchor — the single number the rest of the slide is framed around — and to write the slide so that the chart and the spoken move land as one idea, not two.
The structural move is to identify, for each load-bearing slide, the one number that carries the argument. Not a dashboard of seven metrics. Not a comparison table with eleven rows. The one number. “Customer acquisition is being throttled at the rate of 14 per cent annually” is a narrative anchor. Everything else on the slide — the supporting trend, the comparison data, the methodology footnote — is in service of that number. The eye lands on it first. The leader speaks to it directly. The chart is sized and styled so the anchor is visible from the back of the room.
This is not a theatrical move. It is a structural one. The Business Storytelling Mini-Course (£29) covers the discipline of pulling a narrative anchor out of a complex data set and building the slide architecture around it — useful for the recurring scenarios where the team has run rigorous analysis but the committee is responding as though they have been handed a memo rather than a recommendation. For more on the underlying mechanic, our guide to data storytelling covers the discipline of compressing analysis into a single weighable claim.
Presenting data vs presenting a decision wrapped in data
The cleanest mental shift a presenter can make before walking into a senior committee is the move from “I am presenting data” to “I am presenting a decision wrapped in data”. The two postures produce visibly different decks. The first one builds outward from the analysis — context, methodology, findings, implications, recommendation. The second one builds outward from the request — Setup, Stakes, Shift, Stake-out — using only the data that the request actually rests on.
Senior audiences read the difference within the first ninety seconds. A deck that opens with “I am presenting data” reads as informational. The committee settles into a listening posture. They expect to be educated, ask clarifying questions, and probably defer the decision to the next session. A deck that opens with “I am presenting a decision wrapped in data” reads as a request. The committee shifts into a deciding posture. They expect to be asked to choose. The structural change in the room is significant, and it happens before the leader has finished slide one.
The discipline that holds this together is what gets cut. A leader presenting data wrapped around a decision will keep eight slides out of an original twenty-five. The cut slides do not vanish — they move into the appendix, ready to surface if the committee asks for them. Most of the time the committee will not ask. The compressed deck has done the work. For the closely related discipline of how senior committees behave when they receive multiple narrative threads in sequence, see the partner article on the three-story minimum for board presentations.
If the deeper challenge is securing buy-in across stakeholders, not just structuring the deck:
The Executive Buy-In Presentation System is a self-paced Maven programme — 7 modules covering the framework for securing buy-in from senior stakeholders, with monthly cohort enrolment. Optional Q&A sessions are fully recorded. £499, lifetime access to materials.
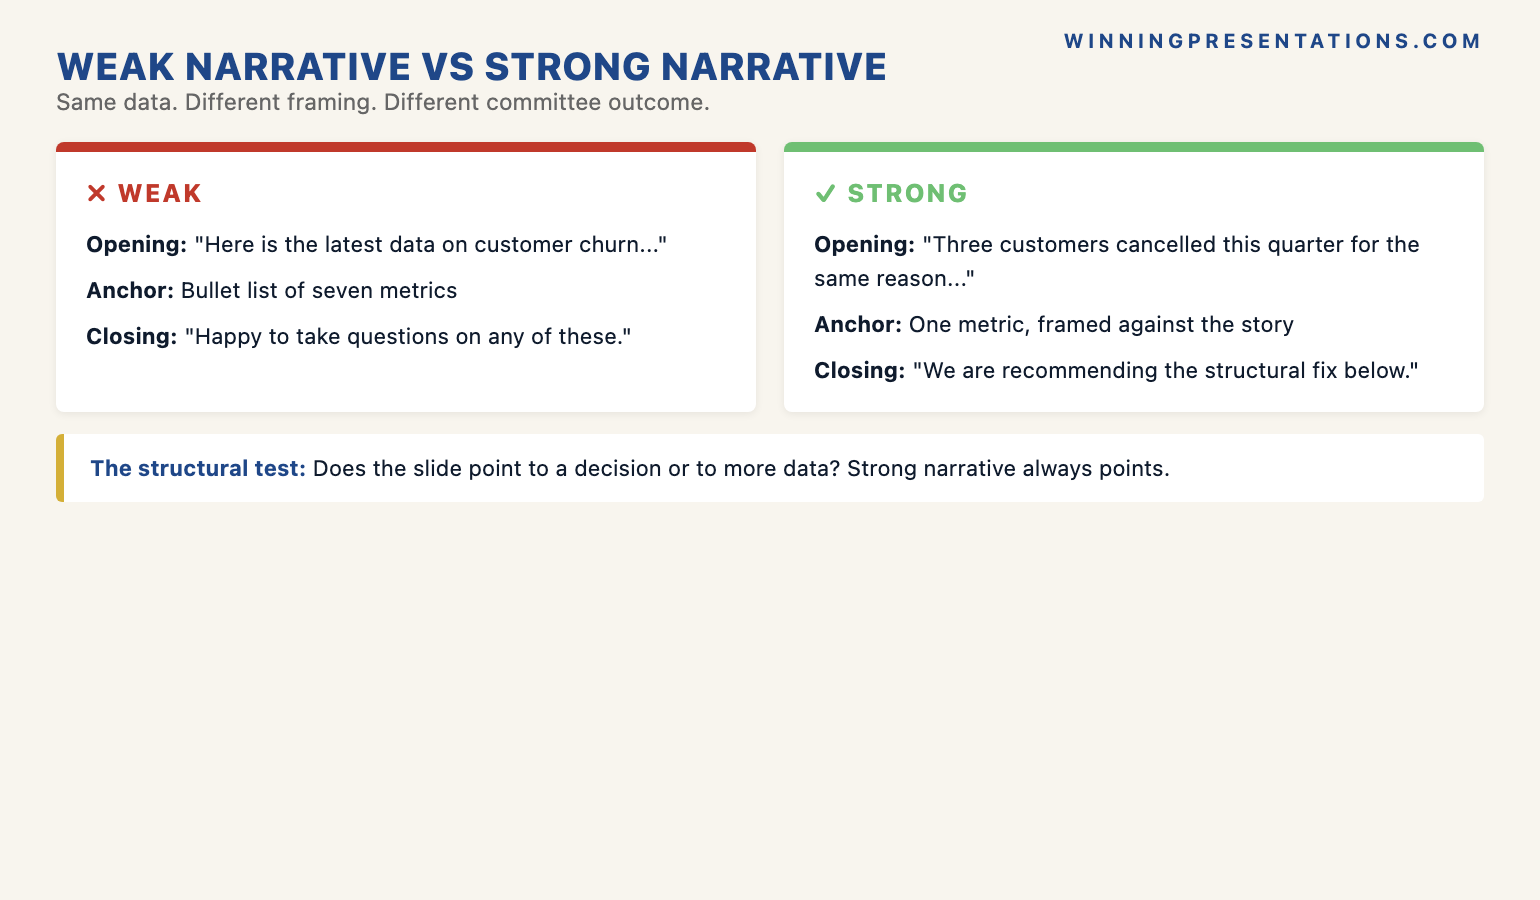
The structural test for narrative work on a slide
The fastest way to audit whether a slide is doing narrative work or just listing is to ask one question: if this slide were removed, would the committee still understand the request being made? If yes, the slide is decorative. If no, the slide is load-bearing. Decorative slides are where decks go to die. They feel necessary because the team that built them has lived with the analysis for weeks. They are not necessary for the committee weighing the choice in twenty minutes.
The second test is verbal. Read the spoken script of the slide aloud. If it sounds like a list — “we have three considerations, the first is, the second is, the third is” — the slide is not yet doing narrative work. If it sounds like a sentence with cause and consequence — “because acquisition is throttled, we forecast losing the budget set aside for this year, which is why we are recommending the platform retirement on an 11-month plan” — the slide has narrative spine. The spine is what the committee follows. Lists do not have spines. Stories do.
The third test is the eye-line test. Stand at the back of the room — or imagine standing at the back of the room — and look at the slide for two seconds. What number, headline, or single image does the eye land on first? If the answer is “nothing in particular, it is just a slide of bullets”, the slide has no narrative anchor. If the answer is a single number, a single short headline, or a single visual, the slide has the structural elements of a narrative slide. Whether the leader uses them well in the spoken delivery is a separate question — but the architecture is in place.
Frequently asked questions
Does business storytelling mean dramatising the data?
No. Storytelling for executive audiences is structural, not theatrical. The four moves — Setup, Stakes, Shift, Stake-out — compress the analysis into the shapes the committee needs to weigh a decision. There is no requirement to find a customer anecdote, build to an emotional peak, or mimic a TED Talk. Senior audiences are largely allergic to that style. The narrative work is in the architecture of the deck and the compression of the data, not in the performance. A finance director reading the four moves out in a level voice will still get more committee engagement than the same finance director reading twenty bullet-stacked slides with full enthusiasm.
What if my data is genuinely complex and does not compress to one number per slide?
Most data is more compressible than the team that built it believes. The exercise is to identify, for each load-bearing slide, the single number that the rest of the slide exists to support. Even highly multivariate analyses usually have a headline figure — the projected impact, the cost differential, the change in risk-adjusted return — that the rest of the data is in service of. If a slide genuinely cannot resolve to a single anchor, that is often a signal that the slide is trying to do two slides’ worth of work. Splitting it into two slides, each with its own anchor, usually solves the problem.
How long should a narrative-led executive presentation actually run?
For a 30-minute committee slot, aim for a 10-minute presentation and 20 minutes for committee discussion and decision. For a 60-minute slot, 15 to 18 minutes of presentation. The discipline is to leave the committee enough time to engage with the trade-offs and arrive at a decision. Decks that consume the full slot rarely get backed in the room — the committee defaults to “let us come back to this” because they have not had time to weigh the request. Compressing the deck to free up committee time is itself a narrative move. It signals that the leader respects the committee’s role in the decision.
Should every executive presentation use the four-part framework?
The framework is built for the scenarios where the committee is being asked to make a decision based on a data-led recommendation — capital cases, strategic shifts, platform investments, structural reorganisations, headcount changes. For pure status updates with no decision being requested, the framework is not the right fit. For genuine decision presentations — which is most senior committee time — the framework provides a structural baseline that the leader can adapt to their topic. The Business Storytelling Mini-Course covers the adaptation patterns for the recurring executive scenarios.
The Winning Edge — weekly newsletter
The Winning Edge is a weekly newsletter for senior professionals who present at the executive level. One short email a week, focused on the structural moves that separate decks committees back from decks they defer. Subscribe to The Winning Edge →
Not ready for the full Storytelling Mini-Course? Start here instead: download the free Executive Presentation Checklist — a one-page reference for the structural moves senior leaders run before every committee deck.
About the author
Mary Beth Hazeldine is Owner & Managing Director of Winning Presentations Ltd. With 24 years of corporate banking experience at JPMorgan Chase, PwC, Royal Bank of Scotland, and Commerzbank, she advises executives across financial services, healthcare, technology, and government on structuring presentations for high-stakes funding rounds, board approvals, and strategic decisions.