
Quick Answer
A quarterly review slide structure works when it follows a four-section frame: position, performance, pivot, provision. Each section maps to one or two slides. The frame turns a quarterly review from a status report into a decision conversation — what changed, what worked, what needs to change next, and what the executive committee needs to provision for the next quarter.
On this page
Mei runs a 14-person product engineering function inside a B2B SaaS company. Her quarterly reviews used to take three days to prepare and ninety minutes to deliver. Last December she finished her QBR feeling she had presented well. Two days later her boss sent a message: “Good update. What did you actually need from us?”
She had not asked for anything. The deck was 22 slides of accomplishments, metrics, and forward plans. The executive committee had no decision to make. The meeting was a transmission, not a conversation. Three months later she rebuilt the QBR around four sections — position, performance, pivot, provision — and went back into the room with eight slides instead of 22. Her boss asked three questions and committed to two resourcing decisions. The QBR became useful for the first time in two years.
If your QBR ends with no decision asked for and none made
A four-section structure forces every quarterly review into decision-shape. The exec committee leaves the room knowing what changed, what they need to provision, and what they decided.
Why most QBRs fail to drive decisions
Standard QBR templates inherit a structural flaw: they are organised around what we did, not what changed. The result is a quarterly ritual that consumes calendar time without producing decisions. Three patterns recur across companies of every size:
The “Q1 Highlights” syndrome. Slide 2 lists six bullets summarising the quarter’s achievements. Slide 3 lists six more. By slide 5 the executive committee has skim-read the highlights, formed an impression, and lost interest. Highlights are not a position; they are a narrative the team writes about itself. Senior audiences need the position — what changed in the operating reality the team owns — not a curated set of wins.
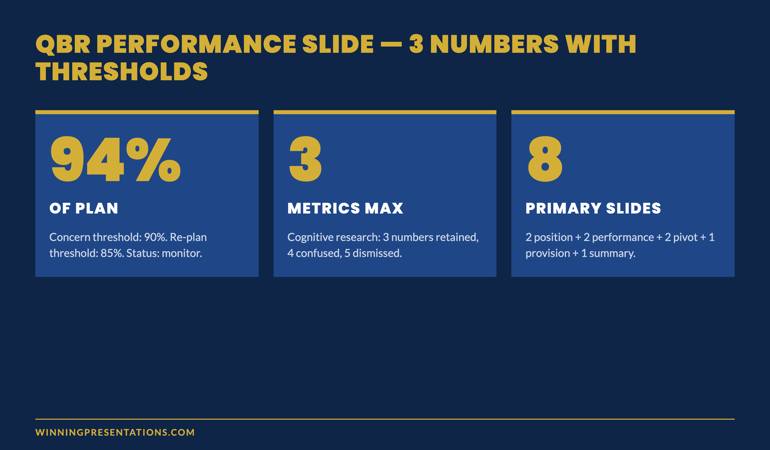
Performance metrics presented without thresholds. A slide showing revenue at 94% of plan reads differently when the room knows the threshold for concern is 90% and the threshold for re-planning is 85%. Without the thresholds, the metric becomes a Rorschach test — every committee member projects their own anxiety onto it. The conversation that follows is about the metric, not the implication of the metric.
No provision request. The most common failure mode of a QBR is to end without asking the executive committee for anything. No headcount decision. No budget reallocation. No prioritisation choice. Senior committees exist to make those calls; a QBR that does not ask for any is using their time inefficiently. The exec committee will not initiate the request on your behalf — they expect the team to know what it needs and ask.
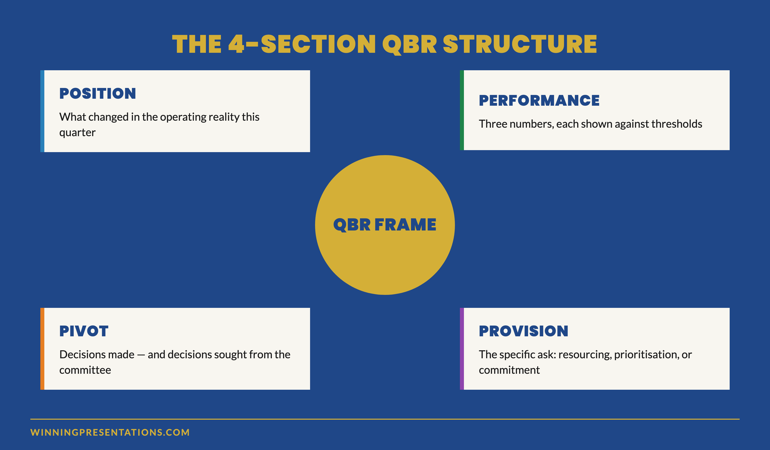
The 4-section structure: position, performance, pivot, provision
The four-section frame works because each section answers a question the executive committee needs settled before they can usefully engage with the next.
Position. Where the function is now, relative to the position they held three months ago. The change in the operating reality. Two slides maximum.
Performance. The three or four metrics that matter, each shown against its threshold for concern and threshold for re-planning. Two slides.
Pivot. The decisions the team has already made for next quarter, and — separately — the decisions the team is bringing to the committee for input or approval. One or two slides.
Provision. The specific resourcing, prioritisation, or commitment the team needs from the committee in the next quarter. One slide.
Eight primary slides. An indexed appendix with everything else. The discipline is in the front eight; the appendix can run to whatever depth the function requires.
Build slides that earn time on the agenda
Stop running QBRs that end with no decision
- 26 templates covering QBR, board, performance review, and strategic decision slides
- 93 AI prompts for drafting position statements, performance commentary, and provision asks
- 16 scenario playbooks including QBR with mixed performance, QBR after missed targets, and QBR before resourcing decisions
- Master checklist for stress-testing every slide before the meeting
Executive Slide System — £39, instant access, 30-day refund if it does not fit your next quarterly review.
Get the Executive Slide System →
Designed for senior professionals running quarterly reviews with executive committees.
Section by section: what each one carries
Position — what changed in the operating reality
The position section answers one question for the committee: where is this function now, that it was not three months ago? Not “we delivered X.” Not “we launched Y.” The position is the change in the underlying reality — pipeline shape, customer mix, technical debt level, regulatory exposure, organisational health. The committee needs the position because every other section is interpreted in light of it.
Two slides is enough. The first describes the position in three lines. The second visualises the change — a chart, a quadrant shift, a heat-map comparison between this quarter and last. Avoid the temptation to add a third slide; the position is meant to be read fast and held in the room as backdrop for everything that follows.
Performance — three numbers, each with thresholds
Performance is where most QBRs lose discipline. The instinct is to show every metric the team tracks. Resist it. The committee can absorb three or four metrics during a QBR; anything beyond that gets skimmed and forgotten. Choose the three metrics that matter most for the committee’s decisions, and show each one against two thresholds:
- The threshold for concern — at this level we re-plan internally without committee input.
- The threshold for re-planning — at this level we bring the re-plan to the committee.
This treatment turns a metric into a decision instrument. The committee can see at a glance whether the number requires their attention or can be left with the function. It also reduces the time spent debating the metric — once thresholds are visible, the conversation is about whether the threshold is right, not whether the number is good.
Pivot — decisions made and decisions sought
The pivot section separates two kinds of decision. Decisions the team has already made for the coming quarter — informational, no committee input required. Decisions the team is bringing to the committee — actively seeking input or approval before the team acts.
This separation matters. Without it, the committee tends to weigh in on every forward-looking statement, which slows the meeting and dilutes the team’s authority. With it, the committee knows when to listen and when to engage. One slide for each side of the pivot is usually enough.
For senior leaders running these reviews regularly, structured QBR slide frames make the pivot section faster to build and easier to navigate. The Executive Slide System includes a QBR pivot template that visually distinguishes decisions made from decisions sought.
Provision — the specific ask
The provision slide is where the QBR earns its place on the calendar. It states the resourcing, prioritisation, or commitment the function needs from the committee for the next quarter. Three components:
- The ask, in one sentence — what specifically you need from the committee.
- The cost or trade-off the committee is being asked to accept.
- The decision required from the committee in this meeting (or, if appropriate, by a stated date).
If a QBR has no provision ask, the meeting can be replaced by a written update. That is a useful test: could this QBR have been an email? If yes, restructure the deck to include a provision section that earns the meeting. If no provision ask is genuinely needed for the quarter, propose to the committee that the next QBR be replaced by a written brief and a 20-minute Q&A.
Data discipline: three numbers per section
Each of the four sections should carry no more than three numerical claims on its primary slide. This is a hard discipline that improves QBRs more than any other single change. Three reasons:
The committee remembers three. Cognitive research on senior decision-makers consistently shows that three numbers per topic are retained, four are confused, five are dismissed. The QBR that presents twelve numbers on a single slide is teaching the committee to skim.
Three numbers force prioritisation. The team has to choose which three numbers carry the meaning. That choice is itself an act of senior judgement. The committee will read the choice as well as the numbers; the slide that confidently elevates three metrics signals a function that knows what matters.
Three numbers leave room for the question. A slide with three numbers leaves cognitive space for the committee to ask “what about X?” That question is the moment the QBR becomes a conversation. A slide with twelve numbers crowds the question out; the committee disengages instead of probing.
The slide system senior professionals use in banking, biotech, SaaS
Quarterly reviews. Board papers. Investment proposals. Strategic pivots. The same five-section logic underneath, scenario-specific templates on top. Executive Slide System — £39, instant access.
Get the Executive Slide System →
Designed for senior professionals running QBRs, board updates, and strategic reviews.
Frequently asked questions
How long should a QBR deck be in total?
Eight primary slides — two for position, two for performance, two for pivot, one for provision, and one summary. Plus an indexed appendix that can run to whatever depth the function needs. The appendix is for committee navigation during Q&A; it is not a place for slides that did not earn a position in the front eight.
What if the committee asks for “all the numbers” rather than three?
That request usually means the committee does not trust the team’s prioritisation. The fix is to have the prioritisation conversation explicitly: which three numbers would the committee want to see if they could only see three? Once that is settled, the committee tends to relax into the discipline. The “all the numbers” request rarely means they want to see twelve metrics every quarter.
Can this structure work for a quarterly business review with a customer?
Partially. The four sections still apply — position, performance, pivot, provision — but the audience is different. Customers want to see how their relationship with you has changed, not how your function has changed. The position section becomes the relationship position; the provision section becomes the joint commitment for the next quarter. The structure holds; the semantics shift.
What if there is no pivot to discuss this quarter?
That is rare in any function genuinely operating. If the team has made no decisions for the next quarter and is bringing nothing to the committee, the committee will conclude either that the function is on autopilot or that the team is concealing the pivot. Either reading damages credibility. If the quarter genuinely contains no pivot, name it explicitly: “This quarter contains no material change in direction. Here is why we believe the current plan continues to be right.” That framing converts a non-pivot into a deliberate act of judgement.
The Winning Edge — weekly newsletter for senior presenters
One framework, one micro-story, one slide pattern — every Thursday morning, ten minutes’ read. The senior leaders who subscribe present to executive committees, boards, and investors weekly.
Not ready for the full system? Start here instead: download the free Executive Presentation Checklist — covers the four-section QBR test you can apply to your next deck before it leaves your desk.
For the partner article on board-pack structure, see board-ready executive slide templates.
Mary Beth Hazeldine — Owner & Managing Director, Winning Presentations Ltd. With 24 years of corporate banking experience at JPMorgan Chase, PwC, Royal Bank of Scotland, and Commerzbank, she advises senior professionals across financial services, healthcare, technology, and government on quarterly review structure, board paper format, and high-stakes executive communication.