Quick answer: The pipeline presentations sales directors use to land quarter close with the executive committee follow a four-prompt Copilot sequence: gap-to-quota framed honestly, top-five named deals with a single-line health read, the contention list (deals slipping or at risk), and an explicit ask of the room. The default Copilot output produces a percentage-heavy deck with no names, no asks, and no path to action. The corrected sequence produces a deck the CRO and CEO can intervene on. This article walks through each prompt, the constraint that makes it work, and what still requires the sales director’s own read.
Jump to
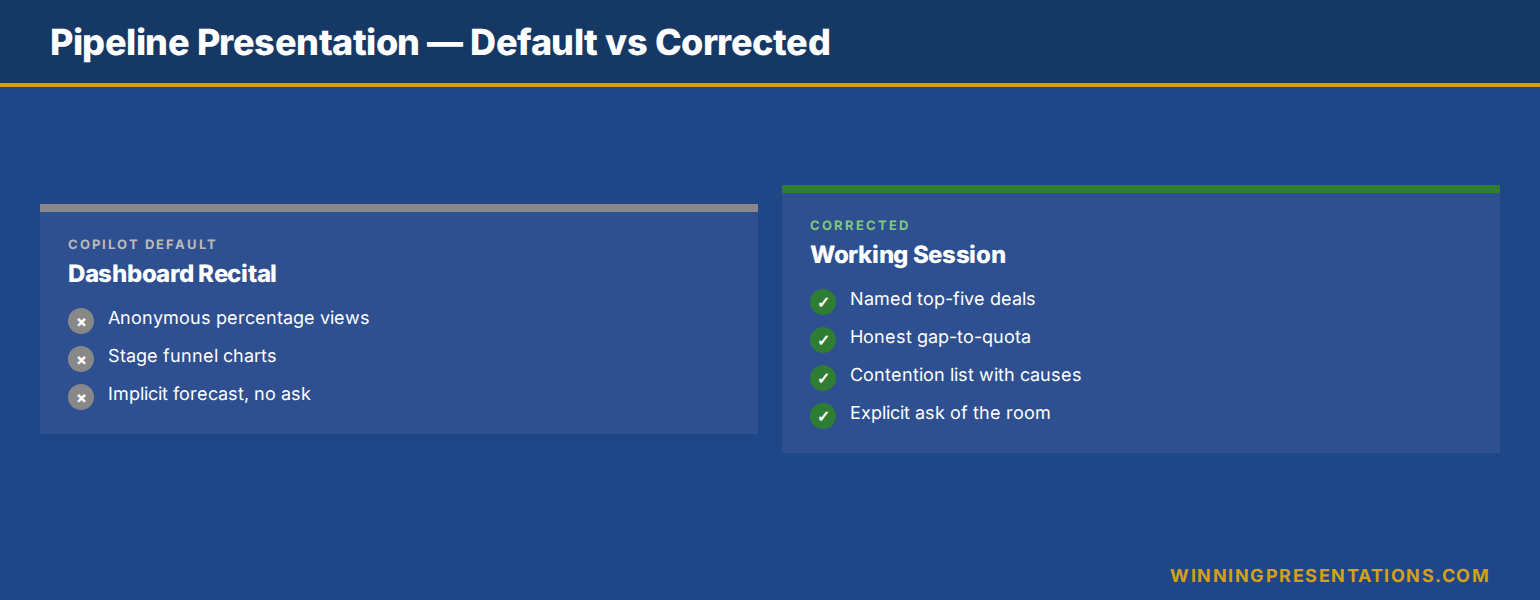
Mason Crowell is the regional sales director for an enterprise software business covering UK and the Nordics. Last quarter he had a forty-five-minute slot at the global commercial review to walk through pipeline, quarter close, and the help he needed from the CRO and the CEO. The week before, he asked Copilot to produce a pipeline deck from the source CRM extract — opportunities, stages, weighted forecast, history. Copilot returned eighteen slides full of percentages, stage funnels, and quota-to-date charts. Mason walked into the meeting with a deck that read like a dashboard.
The CRO interrupted on slide three. “Mason, who are the deals?” There were no names in the deck. The percentages had been generated from the CRM extract correctly, but no opportunity in the entire pipeline was identified by account name, deal value, or sales stage by buyer. The CRO did not need a percentage. She needed to know which five deals would land or slip, and what she could do about them. Mason spent the next twenty minutes pulling up the CRM live and naming the deals from memory. The asks he had prepared never made it onto the screen.
The lesson Mason brought into the next quarter close was that Copilot will produce the deck you asked for, not the deck the executive committee needs. The CRM extract contains every name; the deck Copilot drafts contains none of them. The fix is to instruct Copilot, prompt by prompt, to surface the named deals, the gap to quota, the contention, and the asks. The four-prompt sequence that follows is what shifted Mason’s commercial reviews from dashboard recitals to working sessions where the CRO and CEO actively intervened on quarter close.
Want a Copilot prompt library tuned for executive presentations?
The Executive Prompt Pack is the practical Copilot and ChatGPT library senior professionals use to produce executive-grade presentation output rather than dashboard recitals. Seventy-one prompts covering quarterly reviews, named-deal narrative, contention framing, and the explicit-ask close.
Why most pipeline presentations lose the room
The first failure mode is anonymisation. Pipeline decks default to percentage views — coverage ratio, weighted pipeline by stage, win rate by segment — because the CRM extract is structured that way and Copilot follows the structure. Executive committees do not run on percentages. A CRO does not weigh a deal by its weighted forecast contribution; she weighs it by knowing which buyer it depends on and what is happening with them. Anonymisation strips the deck of the very information the room is gathered to act on.
The second failure mode is the implicit-ask problem. Pipeline decks usually contain implicit asks — a slide titled “Forecast” with a number that is below quota, presented as if it were just information. The committee is left to infer what the sales director wants. Should they intervene on a specific deal? Reallocate resource? Push corporate marketing? The implicit ask gives the room nothing to commit to. The explicit ask gives the room something to either say yes or no to.
The third failure mode is the absent contention story. Every quarter has deals that have moved backwards — pushed into next quarter, lost, or downgraded. Most pipeline decks bury these in the funnel slide, where they appear as a generic stage shift rather than as a named, dated movement. The contention list is the slide the CRO most wants and most rarely sees, because it requires the sales director to put losing deals on a slide and own the explanation. A QBR presentation template that earns the slot always foregrounds the contention and the named deals — these are the data points the executive committee can act on.
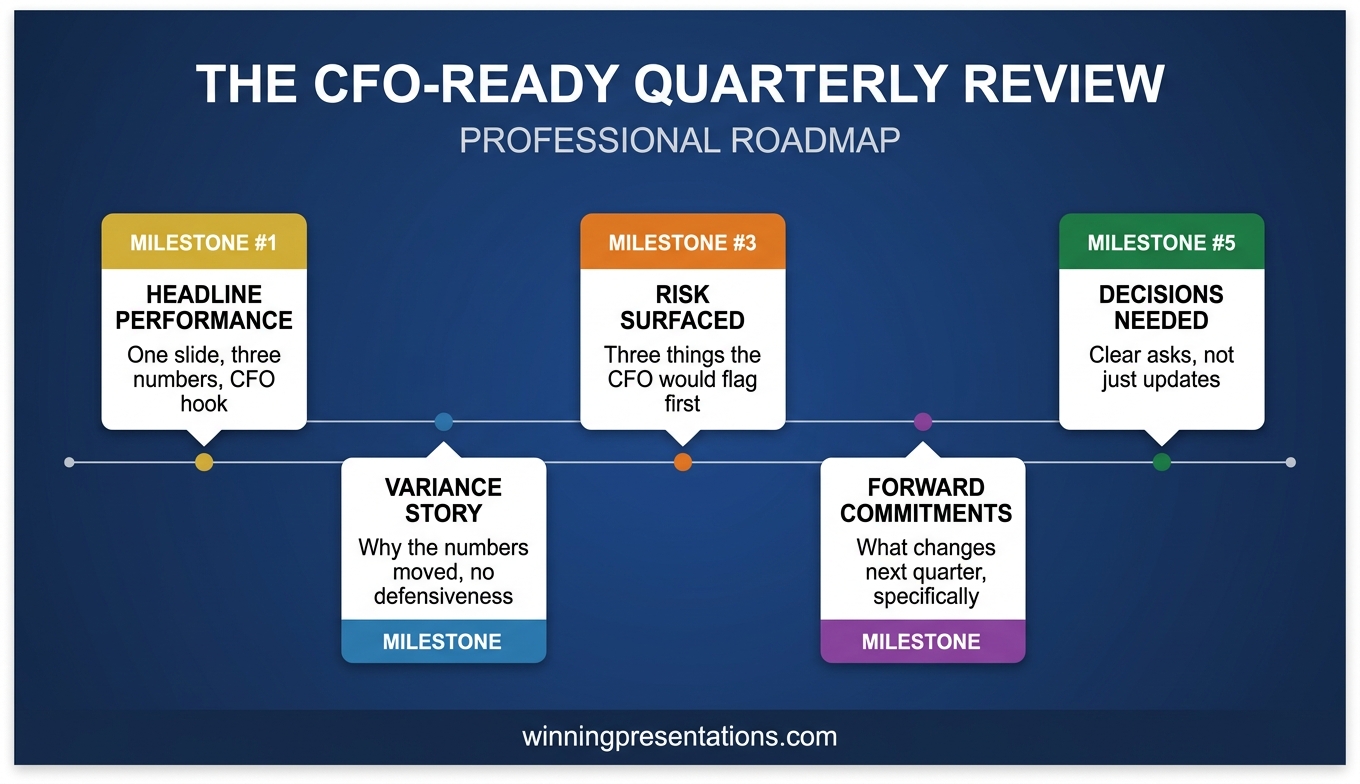
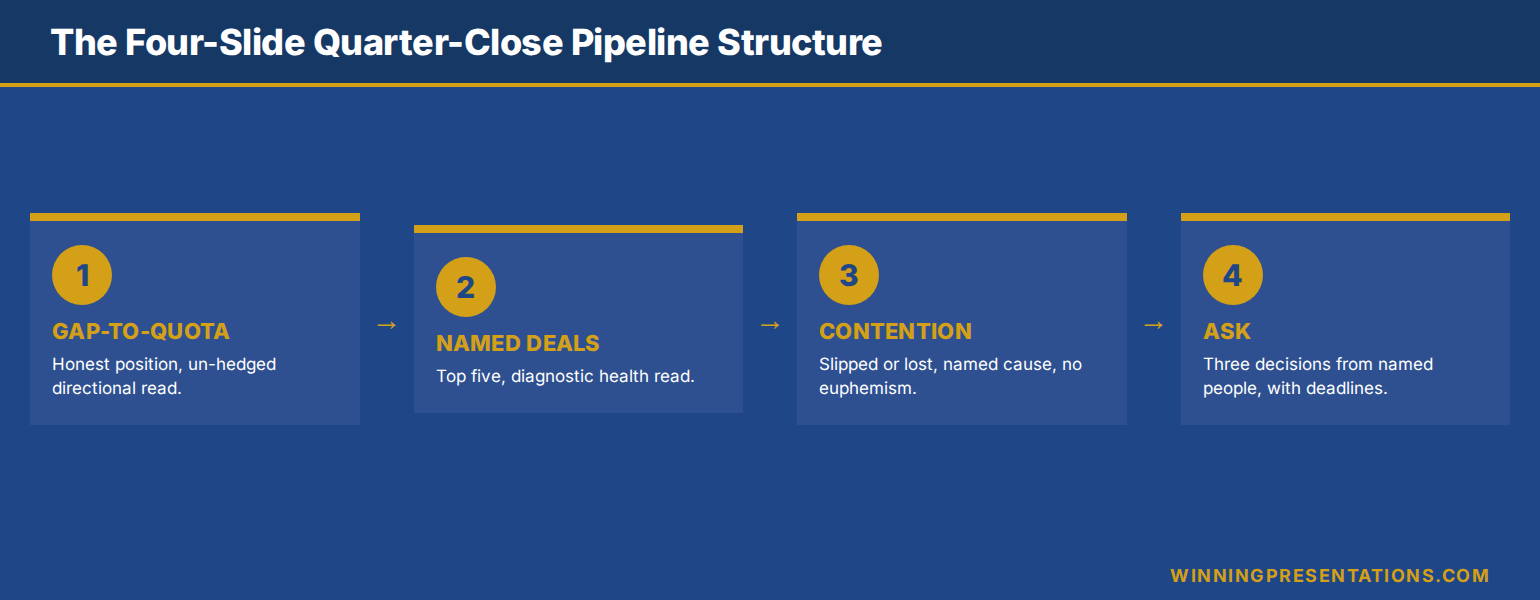
The four-prompt structure that lands quarter close
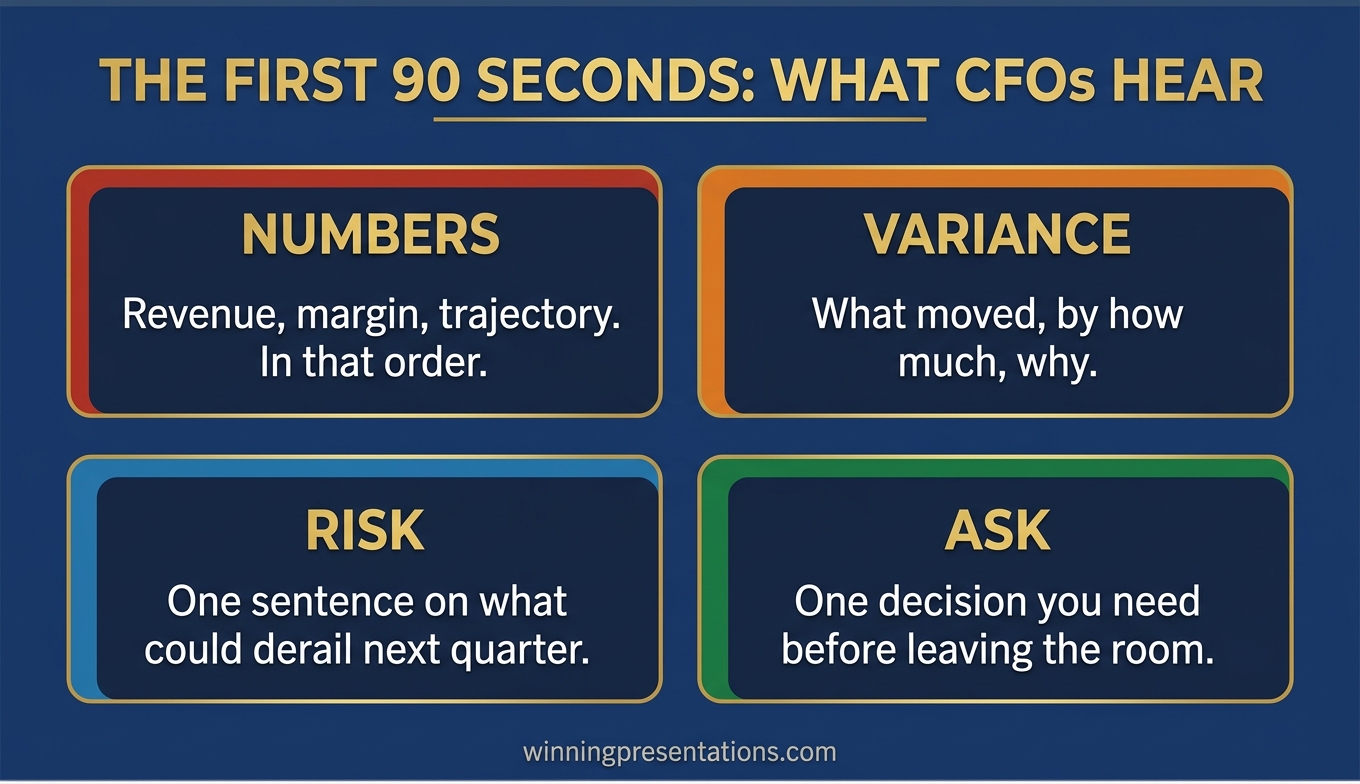
The structure that works for CRO-led commercial reviews is four slides, generated by four prompts in sequence. Slide one is gap-to-quota framed honestly, with the directional read. Slide two is the top five named deals — account, value, stage, single-line health read. Slide three is the contention list — deals slipped, lost, or downgraded since last review, with the reason in plain language. Slide four is the explicit ask — what the sales director needs from the CRO, the CEO, or the cross-functional partners in the room.
Four slides is enough material to fill a forty-five minute slot if the deals are talked through with the right depth. It is also short enough that the committee can read it in two minutes before the meeting and arrive ready to engage rather than ready to be presented to. The shape mirrors the executive presence shift — fewer slides, held longer, with the conversation invited.
The order matters as much as the content. Gap-to-quota first signals that the sales director is not hiding the number. Named deals second gives the room something to grip. Contention third forces the honest conversation about where the quarter is leaking. Explicit ask last closes the meeting with a commitment, not a presentation. Reverse the order and the meeting becomes a recitation that ends without a decision; keep the order and it becomes a working session that ends with the CRO knowing what she needs to do.
The 71-prompt library that sharpens executive sales presentations
Build executive sales decks in 25 minutes, not 3 hours. The Executive Prompt Pack — £19.99, instant download — gives you the practical Copilot and ChatGPT prompts senior sales directors, regional VPs, and commercial leaders use to produce QBR, pipeline, and forecast decks that earn the executive committee’s attention.
- 71 ChatGPT and Copilot prompts engineered for PowerPoint presentations
- Pipeline, named-deal, contention, and ask prompts tuned for senior commercial audiences
- Voice-constrained — built to avoid the dashboard-recital tone CROs reject
- Works inside Copilot for PowerPoint and ChatGPT — copy, paste, adapt
- Designed for executive commercial reviews: QBR, board sales review, CRO one-to-one
Get the Executive Prompt Pack →
Built for senior sales leaders presenting pipeline, forecast, and commercial decisions to executive committees and CROs.
Prompt 1 — Honest gap-to-quota
The first prompt produces the gap-to-quota slide. The structural failure most pipeline decks commit on this slide is hedging — presenting a forecast range that conveniently brackets quota, or showing weighted pipeline that obscures whether the actual quarter close will land. The CRO knows the difference. The honest gap slide is the credibility moment for the rest of the deck.
The prompt: “Using the CRM extract provided, produce a single gap-to-quota slide showing: closed-won to date, committed (90 per cent confidence) deals remaining in quarter, best-case (50 per cent confidence) deals remaining, total quota, and the resulting gap as both a value and a percentage. Below the numbers, write one sentence — twenty words maximum — that names the directional read of the quarter. Constraint: do not hedge the directional read. If the quarter is at risk, say so. If it is on track, say so. If close depends on a specific named deal landing, say which deal.”
The “do not hedge” constraint kills the failure mode. Without it, Copilot produces sentences like “the quarter is tracking towards plan with some upside and downside risk” — true of every quarter, useful for none of them. With it, you get sentences like “the quarter lands on plan if Acme closes by 28 May, otherwise we land four hundred thousand short”. That sentence is a CRO’s working brief. Everything else in the deck supports it.
The numeric structure — closed-won, committed, best-case, quota, gap — is the format CROs and finance partners read fluently. Reproducing it without invention is exactly the kind of work Copilot is reliable at, provided the source data is in the prompt. A sales presentation structure that earns executive attention always opens with the numeric position before any narrative — it sets the credibility floor for everything that follows.
Prompt 2 — Top five named deals
The second prompt produces the named-deals slide. This is the slide the CRO most wants and most rarely sees. The default Copilot output produces deal counts and stage progression; the corrected output names the five deals that determine the quarter and tells the CRO what is actually happening with each.
The prompt: “Using the CRM extract, produce a single slide listing the top five deals that determine quarter close, ranked by potential impact on closing the gap. For each deal, show: account name, value, current stage, expected close date, and a one-sentence health read. The health read names the actual driver of the deal — buyer behaviour, internal sponsor, competitive position, contract issue. Constraint: no generic stage descriptions like ‘in negotiation’ or ‘pending decision’. The health read must say something the CRO can act on.”
The “act on” constraint is the discipline. Stage labels are descriptive — they tell the room where the deal sits in your process. Health reads are diagnostic — they tell the room what is happening that the process does not capture. “Acme is at proposal stage, expected close 28 May” is descriptive. “Acme proposal sent, but the new CFO has put a freeze on procurement until the FY25 audit closes — close depends on whether their CEO can carve out an exception” is diagnostic. The diagnostic version is what the CRO needs to weigh whether to call the Acme CEO herself.
The five-deal limit is enforced because pipeline decks that try to cover ten or fifteen deals at this depth lose the executive committee’s attention before the contention list. Five is the count that fits in a fifteen-minute discussion at meaningful depth. Deals six through twenty live in the appendix or in the working CRM view; the CRO can ask for any of them, but the deck does not pre-empt the question.
Prompt 3 — The contention list
The contention list is the slide most sales directors avoid producing. It names the deals that have moved backwards since the last review — slipped, lost, or downgraded — and explains why. The instinct is that putting losing deals on a slide damages credibility. The opposite is true. The CRO assumes deals are slipping; what damages credibility is finding out by accident in Q&A.
The prompt: “Using the CRM extract and any deal-stage change data available, produce a single slide listing every deal of material value that has moved backwards since the last commercial review. Show: account name, value, prior stage, current stage or status, and one sentence on the cause. Constraint: name the cause specifically. If the deal slipped because the buyer’s project was deprioritised, say so. If lost on price, name the competitor and the gap. If lost on capability, name the capability gap. No euphemism.”
The “no euphemism” constraint is the hardest to deliver, especially when contention reflects on either the sales team or the wider business. The discipline is that the executive committee can intervene on a named cause and cannot intervene on a euphemism. “Acme deprioritised the project after a CFO change” is something the CRO can reach into. “Project timing issues at Acme” is something the CRO files away.
The contention slide has a credibility halo effect on the rest of the deck. A pipeline deck that names its losses honestly is read more trustingly when it names its top deals positively. A pipeline deck that hides its losses is read suspiciously throughout. The Executive Prompt Pack includes contention-framing and named-cause prompts for sales, account management, and customer success leaders presenting at commercial governance forums.
Want the full AI-presentation framework, not just prompts?
The Maven AI-Enhanced Presentation Mastery course is the self-paced programme for senior professionals using AI to build executive-grade presentations. 8 modules, 83 lessons, 2 optional recorded coaching sessions. £499, lifetime access — monthly cohort enrolment, no deadlines, no mandatory attendance.
Prompt 4 — The explicit ask
The fourth prompt produces the closing ask slide. This is the slide that converts the meeting from a presentation into a working session. It names what the sales director needs from the room, who they need it from, and by when. Without it, the committee acknowledges the report and moves on. With it, the committee makes commitments.
The prompt: “Based on the gap-to-quota, named deals, and contention from the prior outputs, produce a single closing slide titled ‘Asks’. List up to three specific asks. For each ask, name: who it is from (CRO, CEO, marketing, legal, product, customer success), what the ask is in one sentence, and the deadline. Constraint: each ask must be a decision or commitment from a named person, not an action the sales team will take. If the sales team can do something itself, it is not an ask.”
The “named person” constraint is the working discipline. An ask of “alignment with marketing on Acme account” is a wish. An ask of “Maria from marketing to commit a custom industry-vertical landing page for Acme by 17 May” is a working commitment. The CRO can convert the second into a decision in real time; she cannot convert the first.
The three-ask cap forces priority. Most pipeline reviews could surface six or seven asks, but a list of seven asks is one the committee politely notes and forgets. Three is the count that gets remembered, tracked, and revisited at the next review. The structural discipline of choosing three is the sales director’s strategic call; Copilot can draft the candidates, but the prioritisation is yours.
What Copilot cannot read for you
The four-prompt sequence will produce a usable draft of the pipeline deck in twenty to thirty minutes from a clean CRM extract. What it will not do is read the room you are walking into, and that read is the difference between a deck that lands and a deck that gets nodded through.
The first thing Copilot cannot read is the political weather of the executive committee meeting. If the CEO has been publicly impatient with the regional sales numbers in the last all-hands, the gap-to-quota slide needs different framing — still honest, but explicitly anchored in the recovery path rather than the gap. If the CRO has been backing your region against an alternative regional structure proposal, the named-deals slide needs to make her bet look obvious to the room. The structural draft works for either; the framing edit is yours.
The second is the deal narrative. Copilot can pull stage and value, but the actual story of a deal — why this buyer, why now, why us, what the contention with procurement is really about — lives in the heads of the account team. The diagnostic health read in slide two should be a one-sentence compression of a conversation you have with the account owner before the meeting, not a paragraph the AI invented from CRM notes. Treat the AI draft as a placeholder and overwrite each health read with the actual deal story.
The third is the cross-functional read. The asks slide depends on knowing whether the head of marketing has bandwidth, whether legal can fast-track a contract, whether customer success can bring forward an executive sponsor session. Copilot does not see organisational reality. The asks the AI drafts will be technically correct but politically blind. Walk the asks past one or two cross-functional partners before the meeting; the ones that survive that walk are the ones the room will actually deliver.
Stop presenting pipeline decks the executive committee scrolls past.
The Executive Prompt Pack — £19.99, instant download — gives you the seventy-one Copilot and ChatGPT prompts that produce QBR, pipeline, and forecast decks senior commercial committees actually act on, with voice and structure already constrained for the CRO and CEO audience.
Get the Executive Prompt Pack →
Built for senior sales leaders presenting pipeline, forecast, and commercial decisions to CROs and executive committees.
FAQ
Won’t naming buyers and contention publicly create commercial risk if the deck circulates?
This is the most common objection and worth addressing structurally. The pipeline deck for the executive committee is not the deck circulated to wider distribution. It is a working document for a small senior group, usually under a confidentiality expectation. If your committee circulates pipeline content broadly, that is a process problem to fix at the governance level, not a reason to anonymise the working deck. Sanitised pipeline decks lose the executive committee meeting; the answer is tighter circulation, not weaker content.
How do I produce the diagnostic health read when I do not know the deal in granular detail?
Run the named-deals prompt first to get the structural draft, then book a fifteen-minute call with each top-five account owner the day before the review. Ask one question for each deal: “what is the actual driver of close right now?” The answer is the diagnostic health read. This is the working time the four-prompt sequence buys you back — the AI compresses the structural drafting, you spend the saved hour gathering the diagnostic content that actually makes the deck land.
What if the gap-to-quota slide shows a quarter that is materially below plan and the CRO has not yet been briefed?
Brief her one-to-one before the executive committee meeting. The committee meeting is not the moment for the CRO to discover a major gap; it is the moment for the gap to be discussed in the open. Use the gap-to-quota slide draft as the artefact for the pre-brief, then walk into the committee with the CRO already aligned on the recovery position. The slide does the same job in both rooms; the sequence of who sees it first is the working discipline.
Can the same four-prompt structure work for monthly forecast calls as well as quarterly business reviews?
Yes — with one structural change. Monthly forecast calls usually do not need the contention list as a stand-alone slide; the contention is captured inside the gap-to-quota commentary. The structure becomes three slides: gap-to-quota with current-month directional read, top three named deals for the month, and a single ask. The four-slide structure is for the longer cadence — quarterly reviews, board commercial reviews, half-year reads — where the contention story has accumulated enough to warrant its own treatment.
The Winning Edge — Thursday newsletter
Every Thursday, The Winning Edge delivers one structural insight for executives presenting to boards, investment committees, and senior stakeholders. No general tips. No motivational framing. One specific technique, one executive scenario, one action. Subscribe to The Winning Edge →
Not ready for the full prompt library? Start here: download the free Executive Presentation Checklist — a single-page review you can run on any executive deck before you walk in, including a structural test for QBR and pipeline material.
Next step: open the next pipeline deck on your calendar and rebuild slide one — the honest gap-to-quota with the un-hedged directional read. That five-minute exercise sets the credibility floor for everything else. Once the room trusts the gap number, the named-deals slide and the contention list will land much harder.
Related reading: how to structure a QBR presentation that earns the slot, and copilot prompts for executive presentations across the wider executive deck library.
About the author. Mary Beth Hazeldine is Owner & Managing Director of Winning Presentations Ltd, founded in 1990. With 25 years of corporate banking experience at JPMorgan Chase, PwC, Royal Bank of Scotland, and Commerzbank, she advises executives across financial services, healthcare, technology, and government on structuring presentations for high-stakes funding rounds, approvals, and board-level decisions.