Tag: performance review presentation

29 May 2026
Performance Review Presentation Anxiety: Why It Hits Harder Than Boards

Performance Review Presentation Anxiety: Why It Hits Harder Than Boards

Quick answer: Performance review presentations trigger more anxiety than board meetings for a specific reason: the audience is evaluating you, not the work. Board presentations have stakes, but the stakes attach to the recommendation. Performance reviews have stakes that attach to the presenter — your competence, your judgement, your future. The nervous system processes that as a personal threat, not a professional task. The work to do beforehand is less about polishing the deck and more about separating self-evaluation from self-worth, structuring a defendable narrative, and reducing the unknowns the meeting introduces.

Ngozi has presented to her bank’s executive committee fourteen times in the last three years. She has handled questions from the chief risk officer about a £180m portfolio decision. She has briefed the chief executive on regional strategy. She is, by her own account and by her colleagues’ assessment, calm in high-stakes rooms. And yet, the night before her annual performance review presentation to her line manager and one other senior leader, she could not sleep. She rehearsed talking points she had not needed to rehearse since her first year in the company. The presentation was 25 minutes, half of them hers. She had prepared the content in two hours. The anxiety she felt about it was disproportionate to anything the content justified. She knew this and could not shift it.

What Ngozi was experiencing is one of the most common patterns among senior professionals: anxiety that scales not with the stakes of the decision in the room, but with the proximity of the evaluation to the self. Board presentations are about the work. Performance reviews are about the worker. The nervous system is exquisitely tuned to that distinction, and it responds disproportionately to threats to identity even when, professionally, the stakes are nominally smaller.

This article is about that mechanism, the three specific anxieties it produces, and the preparation work that reduces the load before the meeting. It is not a deck-design article. The deck for a performance review presentation is the easiest part. The hard part happens between the ears in the days leading up to it.

If the nerves are the part you cannot move past:

Conquer Your Fear of Public Speaking is a self-paced programme for senior professionals whose presentation anxiety persists despite competence in the work — built from 35 years of working with executives who present well in some rooms and freeze in others.

Explore the programme →

Why performance reviews hit harder than boards

Board presentations carry decision stakes — money, strategy, organisational direction. The stakes are large, but they are oriented outwards, away from the presenter. Even a contested recommendation, when it gets pushed back, is a pushback on the recommendation. The presenter walks out of the room with the decision still about the work.

Performance review presentations invert that. The stakes are smaller in absolute terms — your annual rating, a development conversation, a band placement — but they are oriented inwards. Every question is, at root, “tell me more about you.” Every silence is, at root, “I am evaluating you.” Every nuance of facial expression on the other side of the table is information the nervous system reads as feedback on you specifically, not on the work.

The neurological response is not metaphorical. The body’s threat-detection system evolved primarily for social threats, not financial ones. Being evaluated by people whose assessment of you matters for your status in the group activates the same circuitry as being assessed by the tribal elders. The fact that the evaluation is benign — your manager probably thinks well of you, the conversation is structured, the outcomes are largely already determined — does not deactivate the response. The body responds to the structure of the situation, not to the rational analysis of it.

This explains why senior professionals who walk calmly into board rooms can feel disproportionate dread before a 25-minute conversation with their line manager. The deck is irrelevant. The threat is structural.

The three anxieties most presenters underestimate

Three specific anxieties tend to fuse into the larger pre-review dread. Naming them separately is the first step in reducing the load.

The mirror anxiety. The fear that the meeting will surface something about yourself you have not yet acknowledged — a weakness, a blind spot, a pattern your manager sees clearly that you do not. Mirror anxiety is heaviest in people who care about getting it right. The protective response is to over-prepare a self-assessment that pre-empts every possible critique, which paradoxically makes the meeting feel more high-stakes because you have invested so much in controlling it.

The injustice anxiety. The fear that you will be misjudged, that contributions you know are real will not be visible to the people in the room, that scope you carried quietly will not be credited. Injustice anxiety produces a particular kind of presentation: defensive, list-heavy, eager to enumerate. The body language reads as anxious because it is. The content reads as protesting too much because, structurally, it is.

The future anxiety. The fear that the conversation will set the next twelve months in motion in ways you cannot yet undo — the project you will be moved off, the role you will not get considered for, the geography you will be asked to move to. Future anxiety is often the heaviest of the three because it is genuinely uncertain. Unlike mirror anxiety, which is about what is already true about you, future anxiety is about what the meeting might trigger that has not yet happened.

The three anxieties of performance review presentations infographic showing each one with its mechanism: Mirror anxiety the fear of surfaced blind spots, Injustice anxiety the fear of misjudgement, Future anxiety the fear of decisions you cannot undo — and the structural preparation pattern that reduces each one.

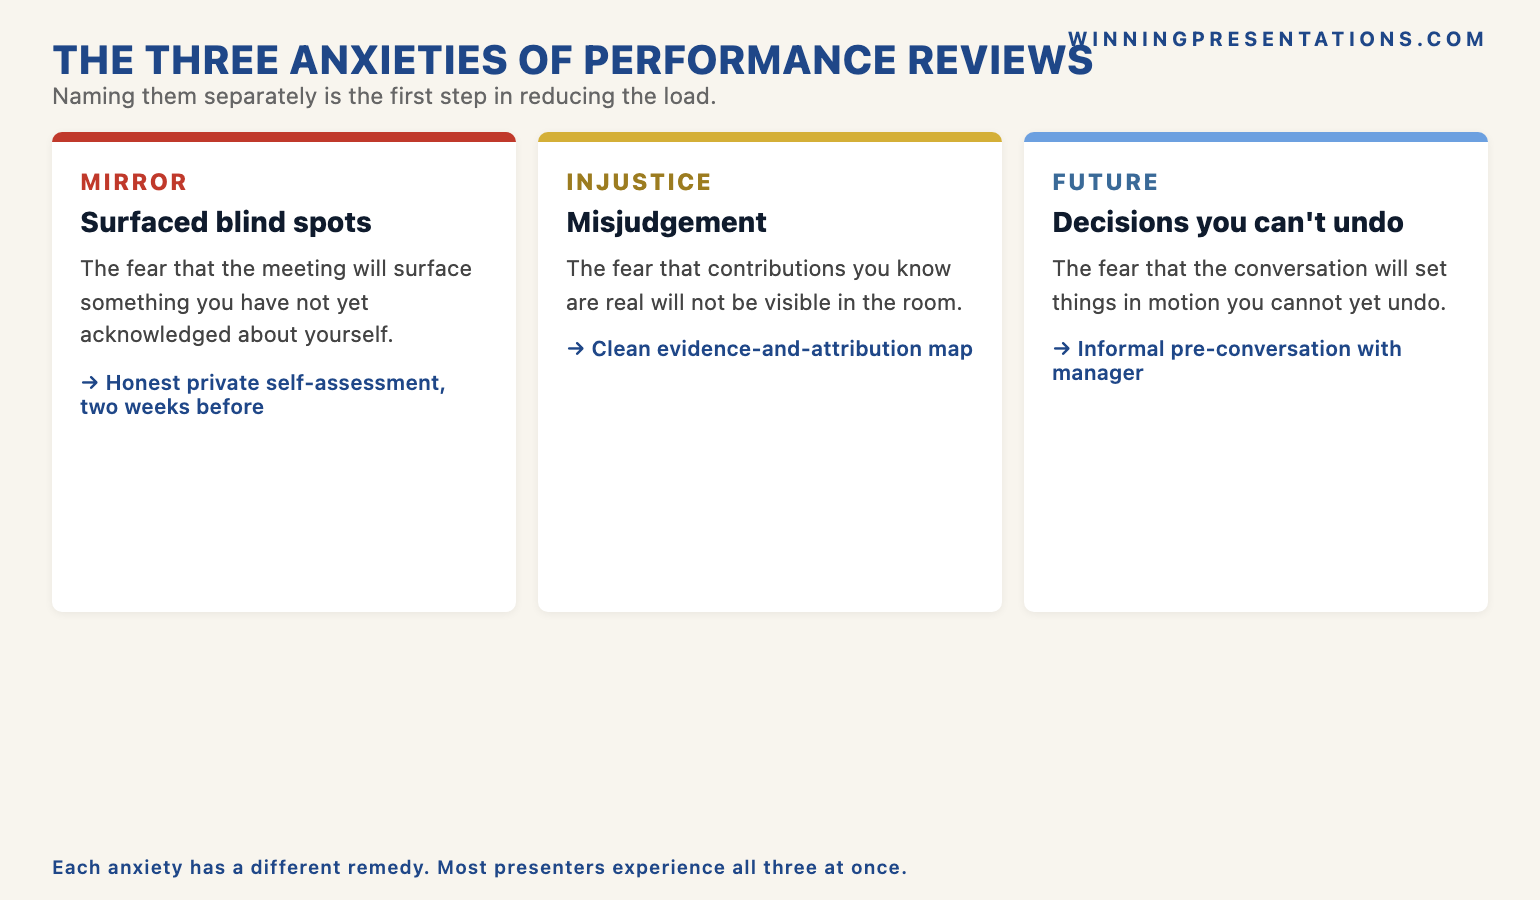
Most presenters experience all three at once and process them as a single cloud of dread. Pulling them apart helps, because each one has a different remedy. Mirror anxiety reduces with honest self-assessment done in private well before the meeting. Injustice anxiety reduces with a clean evidence-and-attribution approach to the deck. Future anxiety reduces with conversations before the meeting that surface the larger picture, so you walk in informed about the territory rather than ambushed by it.

The preparation pattern that lowers the load

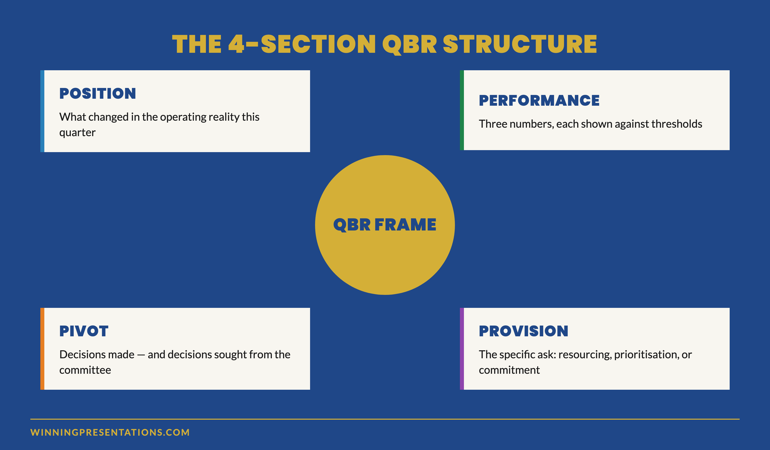
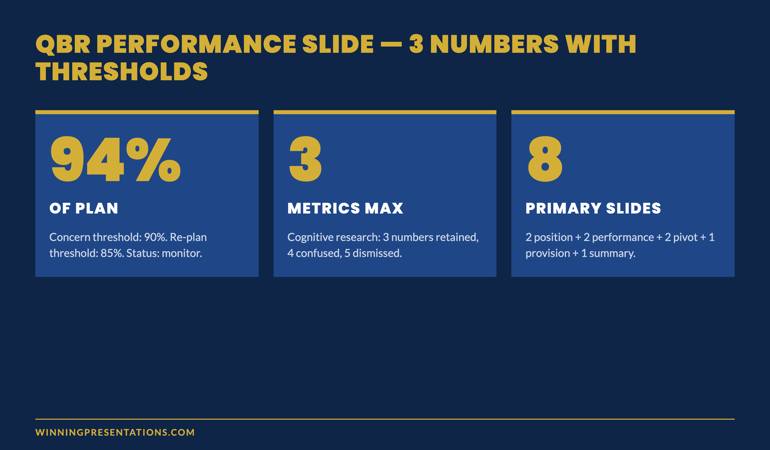
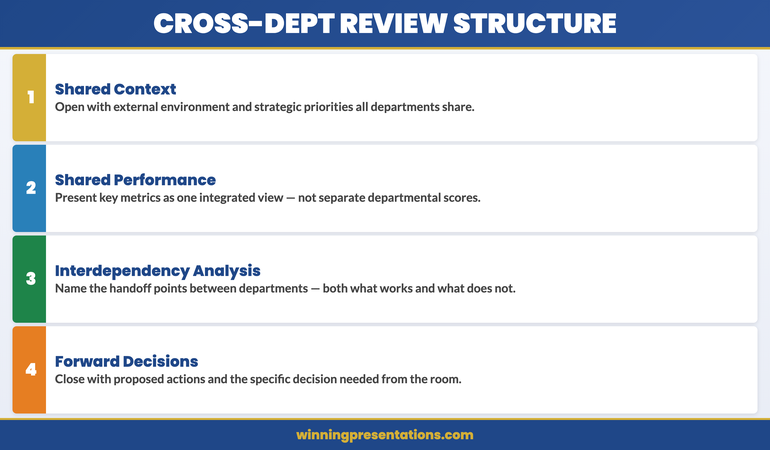
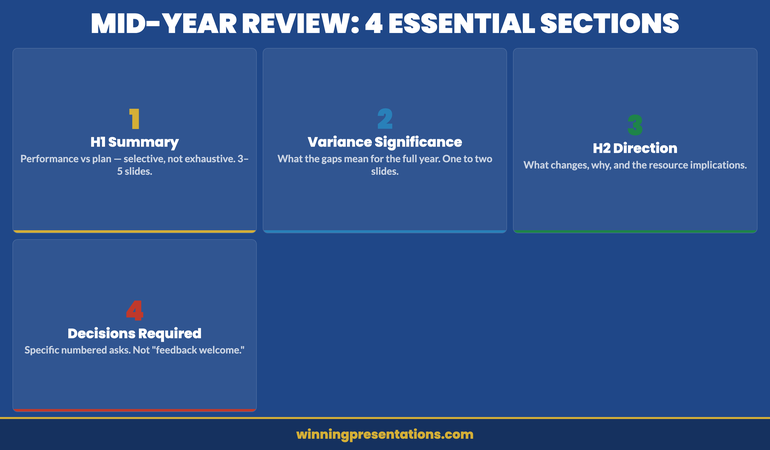
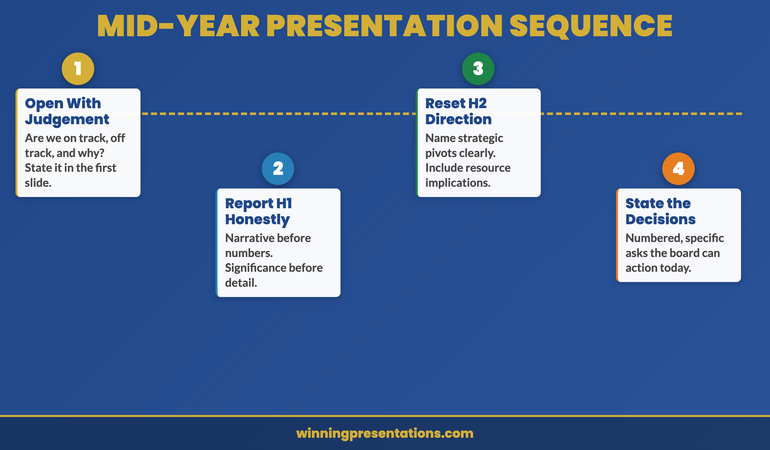
The deck for a performance review presentation should take about ninety minutes to build. Anything more is overwork driven by anxiety, not content. The structure most managers ask for is well-defined: what you have done, how you have done it, what you have learned, what you would like the next twelve months to focus on. Four sections. Five to seven slides. No theatrics required.

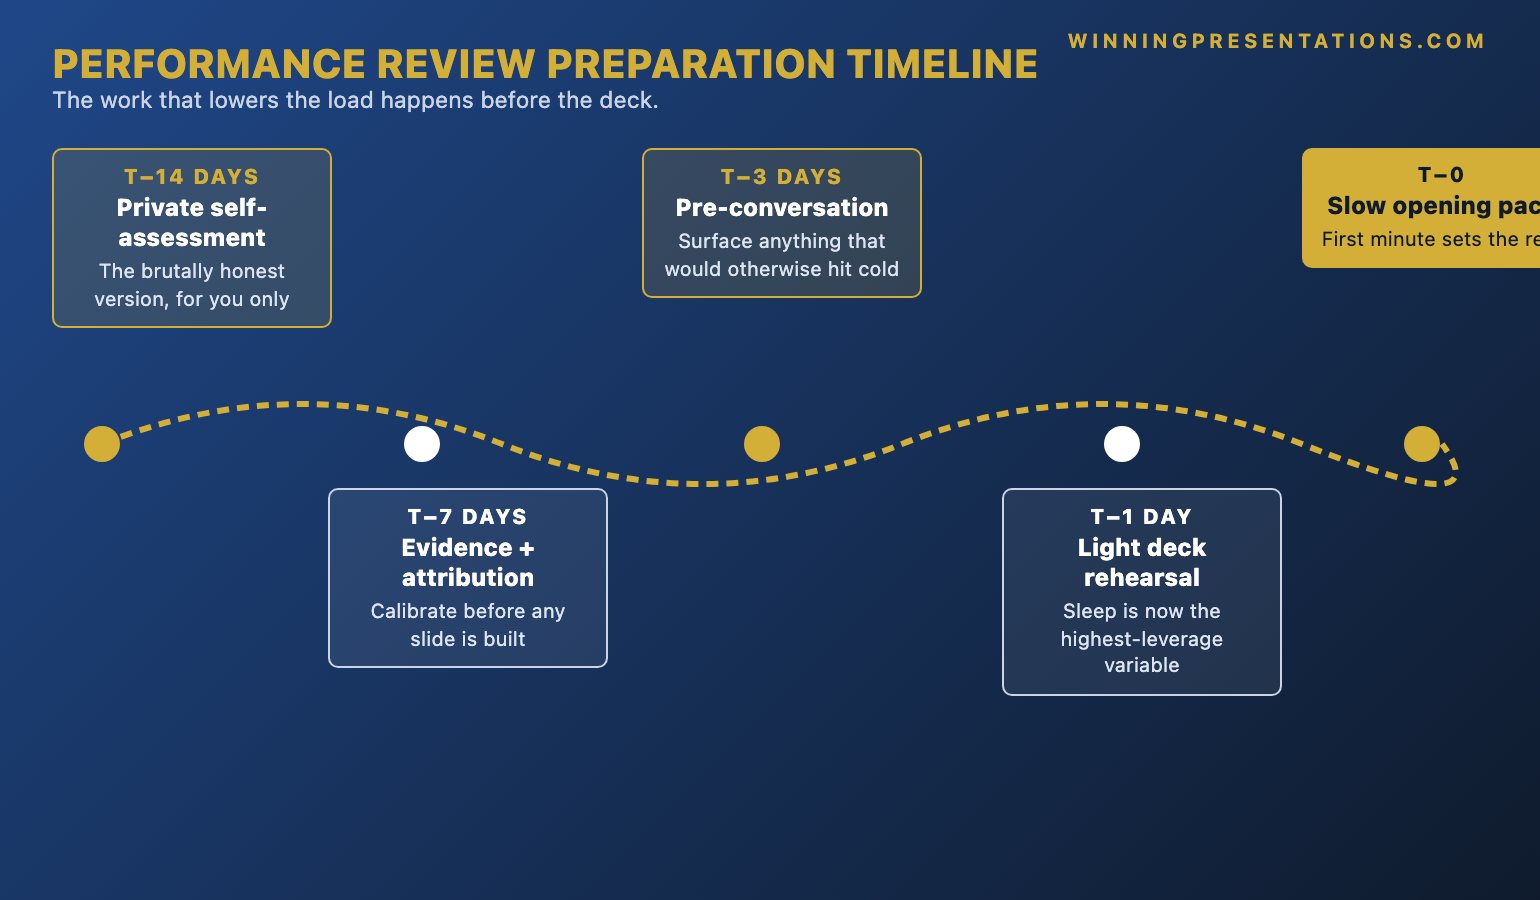
The work that actually moves the needle on the anxiety happens before the deck. Three pieces, in this order:

One. Write a brutally honest self-assessment in private, two weeks before the meeting. Not the polished version that goes in the deck — the version you would tell a trusted colleague over a coffee. What did you do well? What did you do badly? Where did you fall short of the standard you set yourself? Where did you exceed it? Why? This document is for you only. Reading it on the morning of the meeting will be uncomfortable in a useful way: the things you most fear someone else surfacing become much less powerful when you have already named them yourself in private.

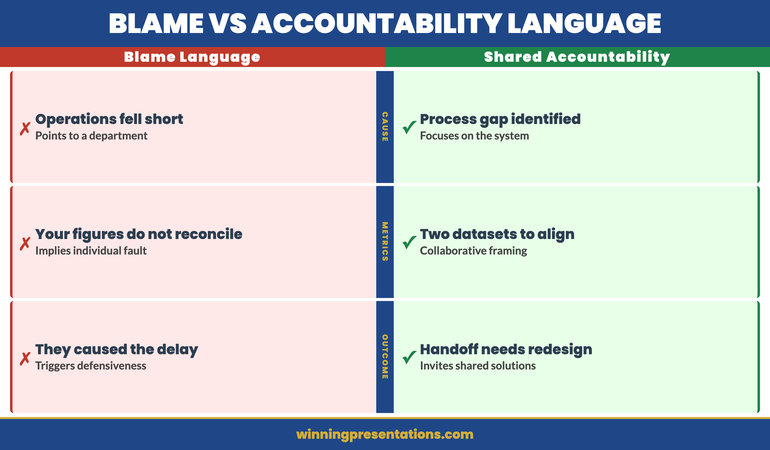
Two. Map the evidence and attribution before you map the slides. Make a list of the major pieces of work you contributed to in the year. For each, write a one-line attribution. “I owned this.” “I led this with the team.” “I contributed to this; the lead was X.” “This was a collective effort.” This is not the version that goes in the slides — it is the calibration that lets you write the slides honestly without overclaiming or underclaiming. Underclaiming is the failure mode senior professionals are most prone to in self-assessments; this exercise pre-empts it.

When the body responds before the meeting starts.

Conquer Your Fear of Public Speaking is a self-paced programme for senior professionals whose presentation anxiety persists despite competence at the work. £39, instant access, designed around the specific psychology of high-stakes presentations where the threat is to identity, not to the project.

  • The nervous-system mechanics of performance anxiety in senior contexts
  • Pre-meeting protocols that reduce baseline arousal in the days before
  • In-the-room recovery techniques that work without anyone noticing
  • The cognitive reframes that separate self-evaluation from self-worth
  • Designed for senior professionals across financial services, healthcare, technology, and government

Explore the programme — £39 →

Instant access. No subscription.

Three. Have the larger-picture conversation before the meeting, not in it. If you have any anxiety about what the meeting might trigger — a role change, a redeployment, a band freeze — try to surface it informally with your manager in the days before. Five minutes of “I want to use the review well; is there anything you would want me to come prepared to discuss?” gives them a chance to flag anything that would otherwise hit you cold in the room. Most managers welcome the question; the ones who do not give you useful information about the relationship.

For the broader pattern of why anxiety the night before a meeting often disproportionate to the meeting itself, see Sunday dread before a Monday presentation — the same nervous-system mechanism is at work.

What to do in the room

The two highest-leverage moves in the room are pace and pause.

Pace is the variable that gives away anxiety most quickly. Senior professionals who present to boards regularly can override their natural pace; in a performance review setting, the override often slips, and the speech speeds up to fifteen or twenty per cent above baseline. The audience reads this immediately. The fix is to deliberately slow the opening minute — feel like you are speaking too slowly to your own ears, which will land as composed to the listener. The first minute sets the rest; if you anchor the pace in the first 60 seconds, the rest tends to hold.

Pause is the variable most senior presenters under-use in performance review settings specifically. The dynamic is asymmetric — your manager has more authority than you do in the room, even if the relationship is warm. There is a temptation to fill silences quickly, to keep talking, to soften any point that feels too direct. Holding a pause after a substantive point — three full seconds, longer than feels comfortable — does two things. It signals that you are not anxious to fill space, and it gives your manager room to engage with what you said rather than waiting for you to finish.

Performance review preparation timeline infographic showing what to do in each phase: T-14 days private self-assessment, T-7 days evidence and attribution map, T-3 days informal pre-conversation with manager, T-1 day light deck rehearsal sleep priority, T-30 minutes opening pace anchor, in the room slow opening pace and 3-second pauses.

For the physical recovery side — when the body responds during the meeting in ways that do affect performance — the techniques in the voice-shakes mid-presentation reset apply directly to performance review settings.

What to do after, regardless of outcome

The hours after a performance review presentation are when the nervous system finishes its threat-response cycle, regardless of how the meeting actually went. Cortisol is elevated for hours; the brain replays moments looking for evidence of how it landed. This is normal and is not a signal that the meeting went badly. It is the body finishing the work it started two days before.

Three things help in the immediate aftermath:

Movement. A 30-minute walk, ideally outside. The body needs to discharge the activation that has been building. Sitting still in your office processing the meeting in your head amplifies it; moving allows it to settle.

One coffee with one trusted person, not five. Talking to too many people about the meeting tends to inflate it — every retelling sharpens minor moments into major ones. One conversation with one person who knows the territory is enough.

A 24-hour pause before drawing conclusions. Whatever the meeting actually meant for the next twelve months, your reading of it the same evening will be coloured by the threat response that has not yet finished. Wait a day. Read your notes from the meeting. The picture will look different from the one your nervous system was painting on the way home.

For the in-the-moment physical symptoms specifically:

Calm Under Pressure covers rapid-response techniques for the physical symptoms of presentation anxiety — shaking hands, racing heart, trembling voice — methods you can use in the room, in the moment, without anyone noticing. £19.99, instant access.

Get Calm Under Pressure — £19.99 →

Frequently asked questions

Why am I more anxious about a performance review than about presenting to the executive committee?

Because the audience is evaluating you, not the work. Board presentations have stakes that attach to the recommendation; performance reviews have stakes that attach to the presenter. The body’s threat-detection system responds more strongly to social and identity threats than to professional-task threats, even when the rational analysis says the executive committee meeting is more consequential.

How long before the meeting should I start preparing?

Two weeks for the private work (honest self-assessment, evidence map, informal conversation with your manager). Ninety minutes for the deck itself. Building the deck earlier than a week out tends to amplify rather than reduce anxiety because every revision pulls you back into the territory the body is trying to settle. The private work is what reduces the load; the deck is the artefact, not the preparation.

What if my manager surprises me with a question I have not prepared for?

Pause. Three full seconds. Then answer at half the pace you would normally use. Surprise questions trigger the speed-up response that signals anxiety; deliberately slowing the answer is the strongest countermeasure. If you genuinely do not know the answer, say so directly: “I have not thought through that — let me come back to it before the end of the conversation.” Senior managers respect that response far more than the panicked filler that usually replaces it.

Is it normal to feel disproportionately anxious if my performance has actually been strong?

Yes, and often more so. Strong performance raises the stakes of the evaluation in your own mind — there is more to lose, and the gap between how the meeting might go and how it should go feels larger. The anxiety is not a signal about performance; it is a signal about how much you care about being seen accurately. That is a healthy professional trait, not a problem to fix. The work to do is on calibrating the response, not on suppressing the underlying care.

When the deck is fine but the dread is not.

Conquer Your Fear of Public Speaking is built around the specific psychology of senior professionals whose anxiety doesn’t match their competence. £39, instant access.

Explore the programme — £39 →

Get The Winning Edge newsletter

A weekly note from Mary Beth on the structure, psychology, and preparation that earns senior approval. One idea, one application, one specific scenario — every Thursday morning.

Subscribe to The Winning Edge →

Not ready for the full programme? Start here instead: download the free Executive Presentation Checklist — a single-page reference for the structural side of senior presentations.

Next step: Block 30 minutes in your calendar two weeks before your next performance review. Write the brutally honest private self-assessment first, before any deck-building. The deck takes ninety minutes; the private work is what reduces the dread.

About the author

Mary Beth Hazeldine is Owner & Managing Director of Winning Presentations Ltd, founded in London in 1990. With 24 years of corporate banking experience at JPMorgan Chase, PwC, Royal Bank of Scotland, and Commerzbank, she advises executives across financial services, healthcare, technology, and government on structuring presentations for high-stakes funding rounds and board approvals.

13 May 2026
Featured image for Quarterly Review Slide Structure: The 4-Section Framework Senior Leaders Trust

Quarterly Review Slide Structure: The 4-Section Framework Senior Leaders Trust

Quick Answer

A quarterly review slide structure works when it follows a four-section frame: position, performance, pivot, provision. Each section maps to one or two slides. The frame turns a quarterly review from a status report into a decision conversation — what changed, what worked, what needs to change next, and what the executive committee needs to provision for the next quarter.

Mei runs a 14-person product engineering function inside a B2B SaaS company. Her quarterly reviews used to take three days to prepare and ninety minutes to deliver. Last December she finished her QBR feeling she had presented well. Two days later her boss sent a message: “Good update. What did you actually need from us?”

She had not asked for anything. The deck was 22 slides of accomplishments, metrics, and forward plans. The executive committee had no decision to make. The meeting was a transmission, not a conversation. Three months later she rebuilt the QBR around four sections — position, performance, pivot, provision — and went back into the room with eight slides instead of 22. Her boss asked three questions and committed to two resourcing decisions. The QBR became useful for the first time in two years.

If your QBR ends with no decision asked for and none made

A four-section structure forces every quarterly review into decision-shape. The exec committee leaves the room knowing what changed, what they need to provision, and what they decided.

Explore the Executive Slide System →

Why most QBRs fail to drive decisions

Standard QBR templates inherit a structural flaw: they are organised around what we did, not what changed. The result is a quarterly ritual that consumes calendar time without producing decisions. Three patterns recur across companies of every size:

The “Q1 Highlights” syndrome. Slide 2 lists six bullets summarising the quarter’s achievements. Slide 3 lists six more. By slide 5 the executive committee has skim-read the highlights, formed an impression, and lost interest. Highlights are not a position; they are a narrative the team writes about itself. Senior audiences need the position — what changed in the operating reality the team owns — not a curated set of wins.

Performance metrics presented without thresholds. A slide showing revenue at 94% of plan reads differently when the room knows the threshold for concern is 90% and the threshold for re-planning is 85%. Without the thresholds, the metric becomes a Rorschach test — every committee member projects their own anxiety onto it. The conversation that follows is about the metric, not the implication of the metric.

No provision request. The most common failure mode of a QBR is to end without asking the executive committee for anything. No headcount decision. No budget reallocation. No prioritisation choice. Senior committees exist to make those calls; a QBR that does not ask for any is using their time inefficiently. The exec committee will not initiate the request on your behalf — they expect the team to know what it needs and ask.

The 4-Section QBR Structure infographic showing Position, Performance, Pivot and Provision sections with the central question each section answers

The 4-section structure: position, performance, pivot, provision

The four-section frame works because each section answers a question the executive committee needs settled before they can usefully engage with the next.

Position. Where the function is now, relative to the position they held three months ago. The change in the operating reality. Two slides maximum.

Performance. The three or four metrics that matter, each shown against its threshold for concern and threshold for re-planning. Two slides.

Pivot. The decisions the team has already made for next quarter, and — separately — the decisions the team is bringing to the committee for input or approval. One or two slides.

Provision. The specific resourcing, prioritisation, or commitment the team needs from the committee in the next quarter. One slide.

Eight primary slides. An indexed appendix with everything else. The discipline is in the front eight; the appendix can run to whatever depth the function requires.

Build slides that earn time on the agenda

Stop running QBRs that end with no decision

  • 26 templates covering QBR, board, performance review, and strategic decision slides
  • 93 AI prompts for drafting position statements, performance commentary, and provision asks
  • 16 scenario playbooks including QBR with mixed performance, QBR after missed targets, and QBR before resourcing decisions
  • Master checklist for stress-testing every slide before the meeting

Executive Slide System — £39, instant access, 30-day refund if it does not fit your next quarterly review.

Get the Executive Slide System →

Designed for senior professionals running quarterly reviews with executive committees.

Section by section: what each one carries

Position — what changed in the operating reality

The position section answers one question for the committee: where is this function now, that it was not three months ago? Not “we delivered X.” Not “we launched Y.” The position is the change in the underlying reality — pipeline shape, customer mix, technical debt level, regulatory exposure, organisational health. The committee needs the position because every other section is interpreted in light of it.

Two slides is enough. The first describes the position in three lines. The second visualises the change — a chart, a quadrant shift, a heat-map comparison between this quarter and last. Avoid the temptation to add a third slide; the position is meant to be read fast and held in the room as backdrop for everything that follows.

Performance — three numbers, each with thresholds

Performance is where most QBRs lose discipline. The instinct is to show every metric the team tracks. Resist it. The committee can absorb three or four metrics during a QBR; anything beyond that gets skimmed and forgotten. Choose the three metrics that matter most for the committee’s decisions, and show each one against two thresholds:

  • The threshold for concern — at this level we re-plan internally without committee input.
  • The threshold for re-planning — at this level we bring the re-plan to the committee.

This treatment turns a metric into a decision instrument. The committee can see at a glance whether the number requires their attention or can be left with the function. It also reduces the time spent debating the metric — once thresholds are visible, the conversation is about whether the threshold is right, not whether the number is good.

Pivot — decisions made and decisions sought

The pivot section separates two kinds of decision. Decisions the team has already made for the coming quarter — informational, no committee input required. Decisions the team is bringing to the committee — actively seeking input or approval before the team acts.

This separation matters. Without it, the committee tends to weigh in on every forward-looking statement, which slows the meeting and dilutes the team’s authority. With it, the committee knows when to listen and when to engage. One slide for each side of the pivot is usually enough.

For senior leaders running these reviews regularly, structured QBR slide frames make the pivot section faster to build and easier to navigate. The Executive Slide System includes a QBR pivot template that visually distinguishes decisions made from decisions sought.

Provision — the specific ask

The provision slide is where the QBR earns its place on the calendar. It states the resourcing, prioritisation, or commitment the function needs from the committee for the next quarter. Three components:

  • The ask, in one sentence — what specifically you need from the committee.
  • The cost or trade-off the committee is being asked to accept.
  • The decision required from the committee in this meeting (or, if appropriate, by a stated date).

If a QBR has no provision ask, the meeting can be replaced by a written update. That is a useful test: could this QBR have been an email? If yes, restructure the deck to include a provision section that earns the meeting. If no provision ask is genuinely needed for the quarter, propose to the committee that the next QBR be replaced by a written brief and a 20-minute Q&A.

QBR Performance Slide With Thresholds infographic showing a metric chart with concern threshold (yellow) and re-planning threshold (red) overlaid against the actual quarterly performance line

Data discipline: three numbers per section

Each of the four sections should carry no more than three numerical claims on its primary slide. This is a hard discipline that improves QBRs more than any other single change. Three reasons:

The committee remembers three. Cognitive research on senior decision-makers consistently shows that three numbers per topic are retained, four are confused, five are dismissed. The QBR that presents twelve numbers on a single slide is teaching the committee to skim.

Three numbers force prioritisation. The team has to choose which three numbers carry the meaning. That choice is itself an act of senior judgement. The committee will read the choice as well as the numbers; the slide that confidently elevates three metrics signals a function that knows what matters.

Three numbers leave room for the question. A slide with three numbers leaves cognitive space for the committee to ask “what about X?” That question is the moment the QBR becomes a conversation. A slide with twelve numbers crowds the question out; the committee disengages instead of probing.

The slide system senior professionals use in banking, biotech, SaaS

Quarterly reviews. Board papers. Investment proposals. Strategic pivots. The same five-section logic underneath, scenario-specific templates on top. Executive Slide System — £39, instant access.

Get the Executive Slide System →

Designed for senior professionals running QBRs, board updates, and strategic reviews.

Frequently asked questions

How long should a QBR deck be in total?

Eight primary slides — two for position, two for performance, two for pivot, one for provision, and one summary. Plus an indexed appendix that can run to whatever depth the function needs. The appendix is for committee navigation during Q&A; it is not a place for slides that did not earn a position in the front eight.

What if the committee asks for “all the numbers” rather than three?

That request usually means the committee does not trust the team’s prioritisation. The fix is to have the prioritisation conversation explicitly: which three numbers would the committee want to see if they could only see three? Once that is settled, the committee tends to relax into the discipline. The “all the numbers” request rarely means they want to see twelve metrics every quarter.

Can this structure work for a quarterly business review with a customer?

Partially. The four sections still apply — position, performance, pivot, provision — but the audience is different. Customers want to see how their relationship with you has changed, not how your function has changed. The position section becomes the relationship position; the provision section becomes the joint commitment for the next quarter. The structure holds; the semantics shift.

What if there is no pivot to discuss this quarter?

That is rare in any function genuinely operating. If the team has made no decisions for the next quarter and is bringing nothing to the committee, the committee will conclude either that the function is on autopilot or that the team is concealing the pivot. Either reading damages credibility. If the quarter genuinely contains no pivot, name it explicitly: “This quarter contains no material change in direction. Here is why we believe the current plan continues to be right.” That framing converts a non-pivot into a deliberate act of judgement.

The Winning Edge — weekly newsletter for senior presenters

One framework, one micro-story, one slide pattern — every Thursday morning, ten minutes’ read. The senior leaders who subscribe present to executive committees, boards, and investors weekly.

Subscribe to The Winning Edge →

Not ready for the full system? Start here instead: download the free Executive Presentation Checklist — covers the four-section QBR test you can apply to your next deck before it leaves your desk.

For the partner article on board-pack structure, see board-ready executive slide templates.

Mary Beth Hazeldine — Owner & Managing Director, Winning Presentations Ltd. With 24 years of corporate banking experience at JPMorgan Chase, PwC, Royal Bank of Scotland, and Commerzbank, she advises senior professionals across financial services, healthcare, technology, and government on quarterly review structure, board paper format, and high-stakes executive communication.

12 Apr 2026
Executive team gathered around a boardroom table presenting cross-department quarterly review data on a large screen

Cross-Department Quarterly Review: How to Stop the Blame Game

Quick Answer

A cross-department quarterly review stops becoming a blame session when you structure it around shared data, forward-facing language, and a single executive narrative — rather than individual departmental reports. The key shift is framing every slide around decisions and progress, not performance scores.

Marcus had been preparing for three weeks. As Head of Operations at a mid-size logistics company, he was responsible for presenting the cross-department quarterly review to the executive committee — a room that included the CFO, two divisional MDs, and the Group CEO.

The first twenty minutes went according to plan. Then the IT Director put up a slide showing system uptime metrics. Operations pushed back. Sales said the delays were causing client churn. Finance said the numbers didn’t reconcile with what they’d seen the previous month. Within thirty minutes, the review had become a tribunal — with every department defending its own data and attacking everyone else’s.

Marcus told me afterwards: “The executive sponsor sat there in silence for most of it. At the end he said, ‘I don’t need to know what happened. I need to know what we’re doing about it.’ Nobody had an answer.”

The problem wasn’t the data. It was the structure. Each department had prepared slides designed to demonstrate their own performance — which meant every difficult interdependency was someone else’s problem. The meeting had no shared narrative, no forward focus, and no mechanism for building agreement. What it produced instead was defensiveness, frustration, and a room full of executives who left with less confidence in the leadership team than when they’d arrived.

Cross-department quarterly reviews are among the most politically complex presentations in business. Done well, they demonstrate executive cohesion and strategic momentum. Done poorly, they become the stage on which leadership teams publicly undermine each other — often without realising they’re doing it.

Preparing for a cross-department review?

If you’re building the deck and wondering how to present shared data without triggering defensiveness, the Executive Slide System gives you a structured framework designed for exactly these scenarios. Explore the System →

Why cross-department quarterly reviews descend into blame

The blame game in quarterly reviews is almost always structural, not personal. It emerges when the meeting is designed around individual departmental accountability rather than shared organisational progress.

When each department prepares its own slides in isolation, a predictable dynamic emerges. Each presenter selects data that reflects well on their function. When there’s a performance shortfall, the natural response is to show how it connects to a dependency in another department. The other department does the same in reverse. The executive audience watches the cycle repeat and loses confidence in the entire leadership tier.

There’s also a presentation format problem. Most cross-department quarterly reviews use a round-robin structure — each department presents in sequence, each for ten to fifteen minutes. This format guarantees fragmentation. There is no shared narrative, no agreed baseline, and no common language for interpreting the data. The executive sponsor receives five separate stories with five separate recommendations that often contradict each other.

The cross-department quarterly review that works is built differently. It starts from a single agreed executive narrative, uses shared data presented once, and keeps every slide oriented towards future decisions rather than past performance. The departments aren’t gone — their data is there — but it’s been integrated into a unified story rather than a collection of individual defences.

For related structure thinking, see how to structure a monthly business review presentation — many of the same principles apply at the quarterly level.

Executive Slide System

Stop Building Slides. Start Building Agreement.

The cross-department quarterly review tests whether your executive communication can rise above departmental politics. The Executive Slide System — £39, instant access — gives you the templates and frameworks to structure a presentation that drives decisions rather than debate.

  • Slide templates for executive scenario presentations including reviews and approvals
  • AI prompt cards to build your quarterly narrative fast
  • Framework guides for structuring complex multi-stakeholder data
  • Scenario playbooks for high-stakes business reviews

Get the Executive Slide System →

Designed for executives who need clarity in complex, multi-stakeholder environments.

The four-part structure that prevents blame before it starts

The most effective cross-department quarterly reviews use a four-part structure that begins with agreement rather than individual data. This structure does something counterintuitive: it removes the incentive to defend departmental performance by framing the entire review as a shared challenge rather than a collection of individual report cards.

The four-part cross-department quarterly review structure: shared context, performance against shared goals, interdependency analysis, and forward decisions — infographic showing each stage

Part 1 — Shared context (2–3 slides). Open with the external environment and the strategic priorities that all departments are working towards. This reframes the review from “how did each department do?” to “how are we tracking as a business?” Senior executives respond well to this framing because it mirrors how they think about the quarter.

Part 2 — Performance against shared goals (4–6 slides). Present the key metrics that cut across all departments — revenue, customer satisfaction, operational efficiency, and any programme milestones — as a single integrated view. Show interdependencies explicitly. When performance is below target, name the shared nature of the gap before attributing it to any specific function.

Part 3 — Interdependency analysis (2–3 slides). This is the section most reviews skip — and it’s the section that prevents blame. Name the handoff points between departments explicitly. Where a handoff is working, show it. Where it’s not, frame the analysis as a systems question: what is the process that needs to change? Avoid framing any individual department as the cause of a failure.

Part 4 — Forward decisions (2–3 slides). End with a clear set of proposed actions and the decision you need from the executive sponsor. This is what senior audiences are waiting for. If the meeting ends without decisions, it will feel like a waste of time regardless of how good the data was.

The total deck for this structure is typically twelve to fourteen slides — well within the tolerance of most executive committees for a quarterly review.

How to present departmental data without triggering defensiveness

Data triggers defensiveness when it’s presented as a verdict. The moment a slide reads “Operations: underperforming against target,” the Operations Director is no longer listening to the rest of the review — they’re constructing a rebuttal.

The reframe is straightforward: present every metric as a question, not a conclusion. “We’re at 78% against our target of 85% — here’s what the data tells us about where the gap is sitting” is a fundamentally different proposition to “the Operations function missed its target by 7 percentage points.” Same data, different implication. One invites collaboration. The other triggers a territorial response.

A few specific techniques worth using:

Aggregate first, disaggregate second. Start with the combined business-level number, then break it down by function. This trains the audience to see the data as a shared issue before they see their own piece of it.

Use trend lines, not snapshot comparisons. A snapshot comparison (“Q3 vs Q4”) invites argument about what changed. A trend line invites conversation about direction. If the trend is improving, the story is encouraging even if the number is below target. If the trend is worsening, the question becomes what intervention is needed — not who is responsible.

Attribute causality to processes, not people or departments. “The delay in the customer onboarding cycle is sitting in the handoff between CRM and provisioning” is process language. It avoids naming a department as the cause, focuses attention on the system rather than the individual, and creates space for a collaborative solution.

If you’re presenting alongside colleagues from other departments, the cross-functional presentation translation framework covers how to communicate technical or functional data to mixed executive audiences without losing clarity.

The Executive Slide System includes prompt cards specifically designed to help you frame complex performance data in language that builds rather than disrupts executive confidence — see what’s included.

The language of shared accountability

Language is the mechanism through which a cross-department review either builds or destroys alignment. There are specific word choices that consistently escalate defensiveness — and specific alternatives that consistently reduce it.

The highest-risk phrase in any cross-department review is the indirect attribution: “The delays in X were due to late sign-off from Y department.” Even if accurate, this kind of statement — particularly on a slide — puts Y on the defensive for the remainder of the meeting. They will spend the rest of their time accumulating evidence of their own competence rather than contributing to the forward conversation.

The replacement is accountability framing: “The sign-off process between X and Y has created delays in the pipeline. We’ve identified three points where the cycle time can be reduced, and we’re proposing to test a new protocol in Q1.” This acknowledges the same underlying reality but frames it as a shared process improvement rather than an individual failing.

Pronouns matter as well. “We” is always more constructive than “they” in this context. “Our performance in the quarter” is a better frame than “the performance of each function” — even when the reality is that some functions performed better than others. The executives in the room know that nuance exists. They don’t need the slides to dramatise it.

Comparison of blame language versus shared accountability language in cross-department quarterly reviews — infographic showing four before and after examples

What your executive audience actually wants from this meeting

Most presenters preparing for a cross-department quarterly review spend ninety per cent of their preparation time on what the data shows, and almost none on what the executive audience is actually trying to learn from the meeting.

Senior executives attending a cross-department quarterly review are typically trying to answer three questions. First: are we on track to achieve what we committed to, and if not, how far off are we? Second: do the people running this business understand the interdependencies well enough to manage them? Third: what decisions need to be made at this level, and are they being proposed clearly?

They are not trying to audit each department’s performance in granular detail. That level of operational review happens elsewhere. The quarterly review in front of the executive committee is a strategic conversation — and if it descends into operational detail, the room will disengage quickly.

This has a practical implication for your deck. The slides that matter most to a senior executive audience are the context slide (where are we against strategic goals?), the interdependency slide (what’s working, what’s not, what needs a decision?), and the forward-looking recommendation slide (what are we proposing to do, and what do we need from you?). Everything else supports those three moments.

For the board-level version of these principles, how to structure a department update presentation for senior leadership covers the specific adaptations needed when the audience includes non-executive directors.

Executive Slide System — £39

The Quarterly Review Deck That Works

The Executive Slide System — £39, instant access — gives you a structured approach to quarterly business reviews that keeps the focus on decisions, not departmental politics.

Explore the System →

Designed for cross-department reviews, board presentations, and multi-stakeholder updates.

Preparing for the difficult conversation ahead

Even with a well-structured deck and careful language choices, cross-department quarterly reviews sometimes surface genuine conflict that a presentation structure alone cannot contain. A department has significantly underperformed. A key project has stalled. Relationships between senior leaders are strained. In these circumstances, the presentation is only part of the solution — and in some cases, an important conversation needs to happen before the formal meeting.

The pre-meeting executive alignment conversation is one of the most underused tools in this situation. Before a quarterly review that you know will contain difficult news, a short conversation with the executive sponsor — not to rehearse the content, but to align on the narrative and the tone — is almost always worth the time. Sponsors who feel blindsided by difficult data in the room become a destabilising presence. Sponsors who have been briefed become a stabilising one.

When preparing your pre-meeting brief, keep it to three elements: what the challenging data shows, what you believe the underlying cause is (in systems language, not blame language), and what you’re proposing to do about it. That framing gives the executive sponsor everything they need to contribute constructively to the discussion.

Also worth considering: who else in the room needs a pre-meeting conversation? If you know that two department heads are in conflict over a shared metric, a brief alignment call between the three of you before the formal review can prevent thirty minutes of circular argument in front of the executive committee. It’s not about rehearsing a script — it’s about ensuring the room is focused on decisions rather than relitigating the past.

For parallel thinking on this approach when presenting strategic change, the article on structuring a digital transformation board presentation covers similar stakeholder alignment principles in a programme-led context.

Frequently Asked Questions

How long should a cross-department quarterly review presentation be?

For an executive committee audience, aim for twelve to fourteen slides and a sixty-minute meeting: twenty minutes for the presentation, twenty minutes for discussion, and twenty minutes for decisions. If the review is running longer than ninety minutes, the structure usually needs tightening — either there’s too much operational detail in the deck, or the forward-looking decision section is absent and the discussion is filling that gap.

What should I do if another department’s data contradicts mine during the review?

Address data discrepancies before the meeting, not during it. If you identify a conflict between datasets in the preparation phase, align with the relevant department head to agree a shared number and a brief explanation of the variance. Walking into a quarterly review with unresolved data conflicts creates exactly the kind of credibility problem that undermines the entire session. If a discrepancy surfaces unexpectedly in the room, name it calmly: “We’ll need to reconcile these two numbers — can we action that today and send an update to the committee?” This keeps the meeting moving and demonstrates competence rather than concealing the problem.

Who should present which sections of a cross-department quarterly review?

The most effective format is a single lead presenter who owns the shared narrative — usually the most senior executive responsible for cross-functional outcomes — with subject matter contributors speaking to specific technical or operational sections when genuine expertise is required. Avoid the round-robin format where each department presents its own section: it fragments the narrative, makes the meeting feel like a series of individual reports rather than a shared review, and creates the conditions for blame dynamics to emerge.

The Winning Edge — Weekly Insights for Executive Presenters

Every Thursday: one practical insight to sharpen your executive communication. No generic tips — only what works in real high-stakes rooms.

Join The Winning Edge →

Free resource: The Executive Presentation Checklist — a pre-meeting quality check for high-stakes presentations.

About the Author

Mary Beth Hazeldine — Owner & Managing Director, Winning Presentations

With 25 years of corporate banking experience at JPMorgan Chase, PwC, Royal Bank of Scotland, and Commerzbank, Mary Beth advises executives across financial services, healthcare, technology, and government on structuring presentations for high-stakes funding rounds and approvals. She is the creator of the Executive Slide System and the Conquer Speaking Fear programme.

10 Apr 2026
Finance director presenting mid-year business review results on a large screen to a board of directors, confident stance, data charts visible, navy and gold tones, editorial photography style

Mid-Year Business Review Presentation: How to Structure the Second Half

Quick Answer: A mid-year business review presentation must do more than report what happened in the first half. It needs to explain why performance landed where it did, what that means for the second half, and what decisions the board or leadership team needs to make now. The structure that works puts honest assessment first, resets the forward view second, and closes with a clear ask — not a summary of slides already shown.

Henrik had been Finance Director at a professional services group for four years when he presented his first mid-year business review to the full board. He had prepared what he considered a thorough deck — twenty-two slides covering every line of H1 performance against budget, with detailed commentary on each variance. He had spent three evenings getting the numbers right.

Forty minutes into the meeting, the Chair stopped him at slide sixteen. “Henrik, I appreciate the detail. But I need to ask: are we on track, are we off track, and if we’re off track, what are you asking us to do about it?” Henrik realised he had prepared a report when the board needed a presentation. The data was all there. The judgement — and the ask — was entirely absent.

He asked for a brief recess, came back, and spent ten minutes giving the board the two-slide version of what he had just presented: H1 summary in plain language, three decisions required for H2. The Chair thanked him. The remaining board members engaged immediately. The revised deck he prepared for the next mid-year review was eight slides total. It covered everything that mattered.

Preparing for a board or leadership review?

The Executive Slide System includes slide templates designed for financial review, performance reporting, and strategic update contexts — structured for senior leadership audiences.

Explore the System →

What Most Mid-Year Reviews Get Wrong

The most common structural failure in a mid-year business review presentation is the same one Henrik made: conflating a management report with a board presentation. These are fundamentally different artefacts. A management report is a record of what happened. A board presentation is a judgement on what it means and a request for a decision. Presenting the former when the audience expects the latter creates the most common type of mid-year meeting failure — a technically thorough session that leaves leadership without the clarity they came for.

The second most common mistake is the false balance between backward-looking and forward-looking content. Mid-year reviews typically spend sixty to seventy per cent of their time on H1 performance and the remainder on H2 direction. This distribution is usually the wrong way around. Board members and senior leadership have already seen monthly management information during the first half. They are not coming to the mid-year review to hear the same numbers aggregated over a longer period. They are coming to understand the forward implications of what happened and to make decisions about the second half.

A third failure pattern is variance explanation without variance significance. Presenters often explain why revenue was down 12 per cent in March — the sales cycle lengthened, a key deal slipped — without addressing what that means for the full year, what the response is, and whether the structural assumption behind the original target is still valid. The explanation answers the question “what happened?” The board’s question is “what does it mean?” These require different slide structures.

The Structure That Works: Four Sections

The mid-year business review presentation that serves a board or senior leadership team effectively typically contains four sections, not twenty-two slides. The discipline of the structure comes from being ruthless about what each section must do — and removing anything that doesn’t serve that function.

Mid-Year Business Review presentation structure infographic showing four dimensions: H1 Performance Summary (honest assessment of results vs plan), Variance Significance (what the gaps mean for full year), H2 Direction Reset (revised targets and priorities), and Decisions Required (specific asks from leadership)

Section 1 — H1 Performance Summary. Three to five slides covering the most important performance dimensions: revenue versus plan, margin versus plan, key operating metrics, and any strategic milestones that were or were not achieved. The principle here is selectivity, not completeness. If you present twelve revenue lines when the board needs to understand two, you are making comprehension harder, not easier. Choose the metrics that tell the most important story.

Section 2 — What the H1 Results Mean. This section is the one most consistently missing from mid-year review decks. It takes the performance data from Section 1 and applies judgement: are the gaps structural or transient? Is the full-year target still achievable? Have any of the original strategic assumptions been invalidated by H1 performance? One to two slides. Direct language. This is the section where the presenter’s credibility is established or lost.

Section 3 — H2 Direction. What changes, and why. Revised targets if applicable, reprioritised initiatives, resource allocation decisions, any strategic pivots that H1 performance makes necessary. This section is also where the Q2 planning presentation framework overlaps — if the mid-year review triggers a formal Q3 planning cycle, the structure of that conversation follows naturally from this section.

Section 4 — Decisions Required. The most underused section in mid-year review presentations. A clear, numbered list of the specific decisions you are asking the board or leadership team to make. Not “feedback is welcome” — that is a non-ask. Specific decisions: approve revised budget, authorise additional headcount, endorse strategic pivot, confirm risk appetite. One decision per slide if they’re complex; a single decisions list if they’re straightforward. This section transforms the review from a briefing into a governance meeting.

Structure Your Review Deck for Decision-Quality Clarity

The Executive Slide System gives you slide templates and framework guides designed for the financial review and strategic update presentations that senior leadership teams require — structured for board-level comprehension, not management reporting.

  • Slide templates for board review and performance reporting contexts
  • Framework guides for structuring H1/H2 comparative narratives
  • AI prompt cards to build strategic review decks faster
  • Scenario playbooks for presenting difficult performance results

Get the Executive Slide System — £39

Designed for Finance Directors, Strategy leads, and business unit heads preparing senior leadership review presentations.

How to Report H1 Performance Without Losing the Room

The mechanics of how you present H1 performance data matter as much as the data itself. Two principles govern this section more than any others: narrative before numbers, and significance before detail.

Narrative before numbers means that every set of financial figures needs a one-sentence interpretive statement before the data appears. “Revenue for H1 came in at 94 per cent of plan. The shortfall is concentrated in one business line and reflects a single deal that slipped into H2.” That one sentence tells the board what they’re looking at before they look at it. Without it, every person in the room constructs their own interpretation of the same data simultaneously — and you spend the next eight minutes responding to four different reads of the same chart.

Significance before detail means leading with the implications rather than the components. For a variance that matters, present the significance first (“this puts the full-year target at risk if the trend continues”) and the detailed breakdown second. Audiences who understand why a number matters are far better equipped to process the detail than audiences who are still constructing their own significance judgements while you’re explaining line-item variances.

This approach aligns with the principles behind effective quarterly forecast presentations — the same narrative-first logic applies whether you’re presenting one quarter or six months of data. See also the team performance review presentation framework for how to apply the same structure to operational rather than financial metrics.

Resetting Strategic Direction for H2

The H2 direction section of a mid-year business review presentation is where most presenters underestimate the audience’s tolerance for directness. Boards and senior leadership teams do not need protecting from difficult strategic realities. What they cannot tolerate is ambiguity about what the presenter actually thinks.

If H1 performance has invalidated one of the strategic assumptions behind the annual plan, the H2 direction section is the place to say so clearly. “Our original assumption was that the enterprise segment would accelerate in H2 following the product launch. The H1 data suggests that assumption was optimistic. We are recommending a revised focus on the mid-market segment where conversion times are shorter and our H1 win rate was stronger.” That is a strategic pivot. Name it as such. Don’t bury it in hedging language.

The H2 direction section should also address resource implications directly. A strategic reset without resource implications is a strategic statement, not a plan. If the H2 pivot requires reallocating budget, deferring a project, or hiring in a specific area, those decisions need to appear in the deck — not be left as questions for a follow-up conversation. Leaving resource implications unresolved is the most common reason mid-year reviews generate a second meeting rather than decisions.

If you’re building the deck for a board or C-suite review, the Executive Slide System includes templates specifically structured for performance reporting and strategic review contexts.

The Ask: What Decisions Does the Board Need to Make?

The decisions-required section is the most structurally important part of a mid-year business review presentation, and the most commonly omitted. Its absence turns a governance meeting into a briefing session — the board receives information but doesn’t exercise judgement, which defeats the purpose of convening them.

Mid-Year Presentation Sequence roadmap infographic showing four milestones: Open With Judgement (state on-track or off-track in the first slide), Report H1 Honestly (narrative before numbers, significance before detail), Reset H2 Direction (name strategic pivots clearly with resource implications), and State the Decisions (numbered specific asks the board can action today)

A well-constructed decisions list is specific, bounded, and actionable within the meeting. It does not contain questions that require further investigation before a decision can be made — those belong in a pre-read or a follow-up. It contains decisions that the board has enough information to make based on what they’ve just seen in the preceding sections of the review.

The format that works most consistently is a numbered list, one decision per item, with a brief rationale attached to each. “Decision 1: Approve a revised full-year revenue target of £X, reflecting the H1 shortfall and revised H2 conversion assumptions. Rationale: the original target is no longer achievable without material upside on the deal that slipped; the revised target reflects the most credible H2 outlook.” The board can approve, reject, or request modification. That is a governance action. A vague “discussion of performance challenges” is not.

The competitive win-back presentation uses a similar bounded-ask principle — in both contexts, the precision of the ask determines whether the meeting produces a decision or a deferral.

From Performance Data to Board-Ready Presentation

The Executive Slide System gives you framework guides and scenario playbooks for translating complex performance data into the structured, decision-focused format senior leadership teams require.

Explore the Executive Slide System

Designed for senior professionals presenting to boards, executive committees, and investment committees.

Common Structural Mistakes and How to Avoid Them

Several structural patterns in mid-year business review presentations consistently undermine otherwise solid content. Recognising them in advance is more effective than diagnosing them after a difficult meeting.

Too many slides on context that the board already has. A mid-year review is not an onboarding session. Slides covering business model, market overview, and strategic objectives that the board approved in January are filler in a mid-year review. They signal that the presenter is either filling time or lacks the confidence to start directly with performance. Cut context to a single orientation slide if the board composition has changed, or omit it entirely if the audience is consistent.

Variance explanation without variance judgement. “Revenue was down 8 per cent because of a softer market environment in Q2” is an explanation. “Revenue was down 8 per cent, and based on our current pipeline we expect H2 to recover approximately half that gap, which means the full-year target is at risk by approximately 4 per cent” is a judgement with a forward implication. Boards need both; most mid-year decks only provide the former.

Ending on a summary rather than an ask. The final slide should not be “Key Takeaways from H1.” It should be “Decisions Required.” A summary restates what the audience just heard. A decisions slide asks them to act on it. If the meeting ends on a summary, the board leaves feeling informed but not empowered. If it ends on a decisions slide, they leave with clarity about what they did and what happens next.

Frequently Asked Questions

How many slides should a mid-year business review presentation contain?

For a board or senior leadership audience, eight to twelve slides is typically the right range. More than fifteen slides suggests the presenter hasn’t done the work of deciding what matters most. The discipline of reducing a full H1 performance record to twelve focused slides is itself a demonstration of strategic judgement. If supporting detail is essential, it belongs in an appendix that the board can reference rather than in the main deck.

What should go in the appendix of a mid-year review deck?

The appendix of a mid-year business review presentation is for detailed breakdowns that board members may want to reference during discussion — divisional P&Ls, segment-level variance tables, pipeline analysis — but that would slow the main narrative if included in the body of the deck. The rule is: if you need it to make the decision, it belongs in the main deck. If you might need it to answer a question, it belongs in the appendix.

How do you handle a mid-year review when performance is significantly below plan?

Present it directly. The most damaging presentation approach when performance is below plan is to soften, contextualise, or defer the difficult news. Boards have seen every version of that approach and it erodes credibility faster than the performance gap itself. Lead with the honest assessment, explain the root cause analysis, and come prepared with a specific H2 recovery plan and the decisions needed to execute it. Credibility in difficult performance conversations comes from candour and preparedness, not from minimising.

The Winning Edge Newsletter

Weekly presentation strategies, frameworks, and analysis for senior executives and finance professionals. Practical — not theoretical.

Subscribe Free →

Free resource: Download the Executive Presentation Checklist — a pre-presentation reference for board and leadership review contexts.

About Mary Beth Hazeldine

With 25 years of corporate banking experience at JPMorgan Chase, PwC, Royal Bank of Scotland, and Commerzbank, Mary Beth Hazeldine is Owner and Managing Director of Winning Presentations. She advises executives across financial services, healthcare, technology, and government on structuring presentations for high-stakes funding rounds, board approvals, and strategic review cycles. View services | Book a discovery call