Quick Answer
A multi-year budget proposal earns approval when structured around three planning horizons: the investment case for Year 1 (what you are asking for today), the return trajectory for Years 2–3 (when and how value accumulates), and the strategic cost of not proceeding. Finance committees do not reject well-analysed proposals because the numbers are wrong. They reject them because the structure does not make the decision easy.
In This Article
- Why most multi-year proposals fail at the first committee
- The 3-horizon framework explained
- Horizon 1: Building the Year 1 investment case
- Horizon 2: Showing the return trajectory
- Horizon 3: The cost of not proceeding
- Slide structure for the proposal deck
- Preparing for CFO-level questions
- Frequently asked questions
Henrik had the numbers. Three years of financial modelling. Sensitivity analysis across four scenarios. A phased investment plan that any finance director would recognise as thorough. He walked into the capital allocation committee certain that rigour would carry the proposal.
The committee deferred it in 22 minutes.
The feedback was not that the numbers were wrong. It was that the committee could not see “what we are being asked to approve today versus what comes later.” The proposal had been built as a document, not a decision structure. Every year’s costs were present. The decision logic — what the committee needed to commit to now, and why — was absent.
Multi-year budget proposals fail at this exact point more than any other. The financial analysis is usually sound. The presentation structure is not built for how finance committees actually make multi-year decisions.
Need a complete budget presentation structure?
The Executive Slide System includes budget request templates and framework guides designed for multi-year investment cases and CFO-level review committees.
Why Most Multi-Year Proposals Fail at the First Committee
Finance committees reviewing multi-year proposals are not asking “is this a good investment?” in the abstract. They are asking a specific question: “What are we committing to today, and what does that commit us to over three years?” These are different questions, and most proposals are structured to answer only the first.
The most common structural failure is presenting all three years as equivalent decisions. Year 1, Year 2, and Year 3 costs appear in the same table, at the same level of detail, as if the committee is being asked to approve all three simultaneously. Finance committees make phased commitments. They approve Year 1 funding while noting Year 2 and Year 3 dependencies. Conflating the approval decision with the forward commitment is the source of most first-committee deferrals on multi-year proposals.
The second failure is front-loading cost without front-loading rationale. When the first slides a committee sees are tables of expenditure, the default cognitive response is scepticism — which is the appropriate professional reaction to cost proposals. If the rationale for the investment has not been established before the numbers appear, every figure is evaluated against “why are we spending this?” rather than “is this the right level of investment for the return?”
The third failure is the absence of a cost-of-delay argument. Multi-year proposals are particularly vulnerable to deferral because they feel like decisions that can wait. Without a credible, specific cost of not proceeding this planning cycle, you are giving the committee permission to defer without consequence.
The 3-Horizon Framework Explained
The 3-horizon framework restructures a multi-year proposal around how finance committees evaluate long-range investment, rather than how financial models are typically built.
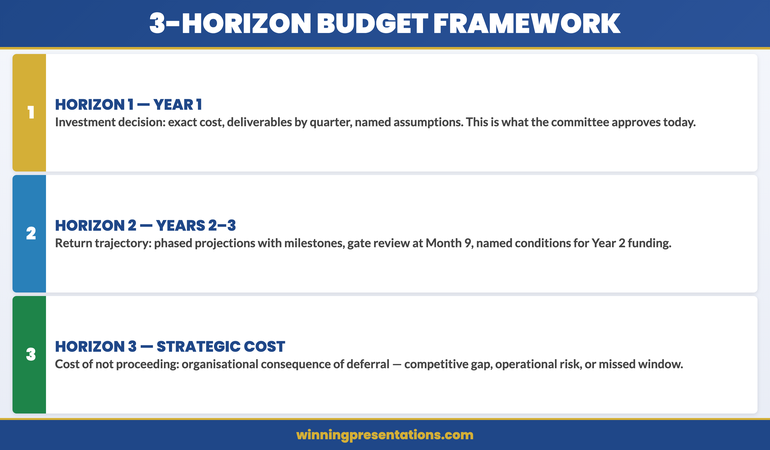
Horizon 1 covers the immediate investment decision: what is being committed to this financial year, at what cost, and for what specific outcome. This is the only horizon the committee needs to approve today.
Horizon 2 covers the return trajectory: how value accumulates in Years 2 and 3, under what conditions, and what the key milestones are that signal whether the programme is on track. This horizon tells the committee what they are agreeing to in principle when they approve Horizon 1.
Horizon 3 covers the strategic context: what the organisation’s competitive or operational position looks like if this investment does not proceed. This is the cost-of-delay argument — the most often absent element, and the most important for overcoming the default deferral instinct.
The framework works because it matches the structure of a finance committee’s decision-making process rather than the structure of a financial model. It separates the approval decision from the forward commitment from the strategic rationale, and presents each in the order a committee needs to process them.
Horizon 1: Building the Year 1 Investment Case
The Year 1 investment case is the most specific and most detailed section of your proposal. This is what the committee is being asked to approve today, and it needs to hold up under direct scrutiny. Every figure should be supportable, every assumption named, every dependency identified.
Structure the Year 1 case around four elements: the problem being addressed, the investment required, the outputs delivered by year-end, and the risk of not investing at this level. The problem statement should quantify the current state using operational data you can defend. “Our current process takes 12 days and introduces rework at roughly one in six outputs” is defensible. “We are 40% less efficient than best practice” is not — the comparison is unverifiable and finance committees notice.
The Year 1 output statement should describe deliverables, not benefits. Benefits belong in Horizon 2. Year 1 deliverables are what you will have produced by year-end: infrastructure built, system deployed, team trained, pilot completed. These are verifiable. They give the committee something concrete to hold you to, which builds credibility rather than eroding it.
Horizon 2: Showing the Return Trajectory
The return trajectory for Years 2 and 3 should be presented at a coarser level of detail than Year 1. Finance committees expect long-range projections to carry wider confidence intervals. Presenting Year 3 figures with Year 1 precision signals either that you have not thought carefully about uncertainty, or that you are suppressing it. A range with named assumptions is more credible than a specific number that implies false precision.
The key elements of Horizon 2 are the milestones that signal the programme is on track, the trigger points that would prompt a review or a pause decision, and the cumulative return projection with its named dependencies. Being explicit about what Years 2 and 3 figures assume — which market conditions, which internal capacity, which decisions not yet made — demonstrates analytical maturity. Finance committees are far more comfortable with named uncertainty than with projections that appear to ignore it.
Present Horizon 2 as a conditional commitment: “Approving Year 1 today gives you visibility of the Year 2 cost envelope. Year 2 funding would be subject to a gate review at Month 9, where we present against the delivery milestones.” This is how large programmes are actually managed. Presenting it explicitly signals governance competence, which builds more confidence with a finance committee than any spreadsheet.
Horizon 3: The Cost of Not Proceeding
Horizon 3 is not about what happens to the project if it is not approved. It is about what happens to the organisation. The two produce very different responses from finance committees. “We will not achieve our efficiency targets” is a project consequence. “Our unit cost per transaction will remain 34% above sector median while competitors who have made this investment begin undercutting our contract pricing” is an organisational consequence. The second creates a decision imperative that the first does not.
The cost-of-delay argument is also where you introduce the competitive, regulatory, or technology context that a three-year investment is typically responding to. If there is a market shift, a regulatory deadline, or a technology window that makes this planning cycle the optimal one for investment, state it in Horizon 3. This reframes the question from “should we do this?” to “is this the right time?” — which most finance committees will answer in your favour if the evidence is credible and specific.
⭐ Maven Flagship — Executive Buy-In
Walk into your next approval meeting prepared
The Executive Buy-In Presentation System gives you 7 self-paced modules covering stakeholder analysis, case construction, and the presentation structures that hold up to scrutiny.
Monthly cohort enrolment — £499, lifetime access.
Slide Structure for the Proposal Deck
The slide order for a multi-year budget proposal should follow the 3-horizon logic, not the financial model structure. The sequence that earns finance committee approval:
Slide 1 — Decision Summary. One slide: what you are recommending, what it costs in Year 1, what it returns over three years, and the consequence of not proceeding. Readable in 60 seconds.
Slides 2–3 — The Problem Being Addressed. Current state data establishing why the investment is necessary. Operational metrics, competitive positioning, or regulatory context — whichever is most relevant. This comes before the cost because it frames the cost as a response rather than a request.
Slides 4–6 — Horizon 1 Investment Case. Year 1 cost breakdown, deliverables by quarter, assumptions, and risks. This is the most detailed section because it is the decision being made today.
Slides 7–8 — Horizon 2 Return Trajectory. Phased return projection with named milestones, gate review points, and the conditions under which Years 2 and 3 funding would be confirmed.
Slide 9 — Decision Request. What you need approved today, in one sentence, with the action assignment and the timeline. This is the closing structure that ensures your proposal ends with a decision rather than a deferral — the same principle behind every effective executive presentation close.
For proposals that have already gone through one failed submission, the budget resubmission framework covers how to restructure after rejection without undermining your credibility on the second attempt. For ongoing tracking once a budget is approved, the budget variance presentation structure gives finance committees the accountability view they expect in subsequent review cycles.
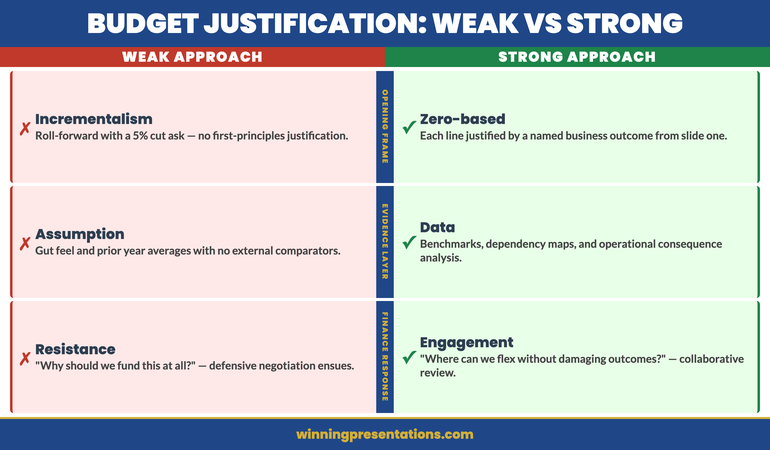
When your organisation uses zero-based budgeting rather than prior-year baselines, the zero-based budget presentation approach runs alongside the three-horizon structure to justify every line of Year 1 investment from first principles.
The Executive Slide System includes budget request templates and AI prompt cards for building the three-horizon narrative quickly before a capital allocation deadline.
Preparing for CFO-Level Questions
Finance directors and CFOs reviewing multi-year proposals will focus on a predictable cluster of questions. Preparing specific answers before the committee meeting is the minimum standard for a proposal of this size.
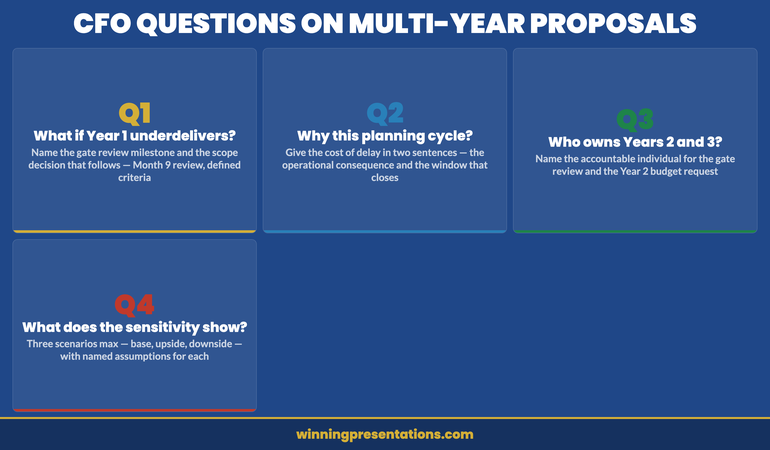
“What happens if Year 1 underdelivers?” This tests whether you have a contingency plan. The answer should name the gate review milestone, define what “underdelivers” means specifically, and describe the decision that follows. “If we are behind Month 9 delivery milestones by more than 15%, we bring a revised scope to the Q4 committee rather than proceeding to Year 2 funding.”
“Why now rather than next planning cycle?” This is the Horizon 3 question in direct form. Your answer is the cost-of-delay argument in two sentences: the operational or competitive consequence of waiting, and the specific factor that makes this planning cycle the right one. Without a credible answer to this question, the proposal is at high risk of deferral regardless of how good the analysis is.
“Who owns the Year 2 and Year 3 commitments?” Finance committees need clear programme ownership before approving multi-year investment. Name the individual accountable for the Month 9 gate review and the Year 2 budget request. If they are not in the room, explain when they will be briefed.
Build the Full Case, Not Just the Financial Model
The Executive Slide System — £39, instant access — includes templates, AI prompt cards and framework guides for budget proposals at every seniority level, from departmental requests to capital allocation committees.
- Budget Request template structured for phased, multi-year investment
- AI prompt cards to build the three-horizon narrative quickly under deadline
Get the Executive Slide System →
Designed for senior budget owners who need approval at the first committee meeting.
Want the complete toolkit?
A multi-year budget pitch to the board is one of seven scenarios senior presenters need to handle without losing the room. The Complete Presenter Bundle pulls all seven products together — slides, Q&A, anxiety, storytelling, delivery, openers, cheat sheets — for £99 (save £91.97 vs buying separately). Lifetime access.
Frequently Asked Questions
How far ahead should a multi-year budget proposal project?
For most corporate planning cycles, a three-year horizon is standard. Year 1 should be presented at budget-line level of detail. Years 2 and 3 are typically shown at programme or workstream level, with clear acknowledgement that they are indicative and subject to gate reviews. Projecting beyond three years in a single proposal usually signals that the scope is too large to be decided in one committee meeting and may need restructuring as a phased programme with separate approval stages.
Should the proposal include a sensitivity analysis?
Yes, but keep it brief and specific. One slide showing the outcome under three scenarios — base case, upside, and downside — with the assumptions that drive each. Finance committees expect sensitivity analysis on investment proposals of this size. However, a sensitivity analysis with more than three scenarios or more than four variables per scenario suggests you are not confident in your base case, which creates the opposite impression from the one you intend.
What is the right length for a multi-year budget proposal presentation?
Nine to twelve slides is the appropriate range for a finance committee presentation. The detailed financial model belongs in a supporting document or appendix, not in the main deck. Finance committees need to make a decision; they do not need to review every assumption in the room. If the committee wants the detailed model, they will ask for it. Present the decision case, not the workings.
How do you handle a committee that wants to reduce Year 1 scope before approving?
Prepare for this in advance by identifying which Year 1 elements are critical-path dependencies for Years 2 and 3 outcomes, and which are not. If the committee wants to reduce scope, offer a restructured Year 1 that protects the dependencies while deferring the discretionary elements. This is more credible than defending the full scope, and it signals that you understand programme priority rather than treating everything as equally essential.
The Winning Edge — Weekly Executive Communication Insights
Each Thursday: one high-stakes communication technique, one real case study, one action you can apply before your next meeting.
Download the free Executive Presentation Checklist — a one-page structure review for any high-stakes meeting.
About the Author
Mary Beth Hazeldine is the Owner & Managing Director of Winning Presentations. With 25 years of corporate banking experience at JPMorgan Chase, PwC, Royal Bank of Scotland, and Commerzbank, she has delivered high-stakes presentations in boardrooms across three continents.
A qualified clinical hypnotherapist and NLP practitioner, Mary Beth advises executives across financial services, healthcare, technology, and government on structuring presentations for high-stakes funding rounds and approvals.