
The Quarterly Forecast Slide Everyone Dreads Building (Simplified to 20 Minutes)
The CEO stopped the presenter on slide 4. “Start over,” she said. “But start with the decision.”
The presenter — a VP of Finance at a FTSE 250 firm — had spent two full days building a quarterly forecast deck. Fourteen slides of revenue projections, pipeline assumptions, risk scenarios, headcount impact modelling, and regional breakdowns. He thought he was being thorough. The CEO thought he was wasting her time.
Four words changed how he built every forecast slide after that: “What do you need from me?”
That’s the question your quarterly forecast presentation simplified to its core is really answering. Not “here’s what the numbers say.” But “here’s what you need to decide, and here’s the data that gets you there.”
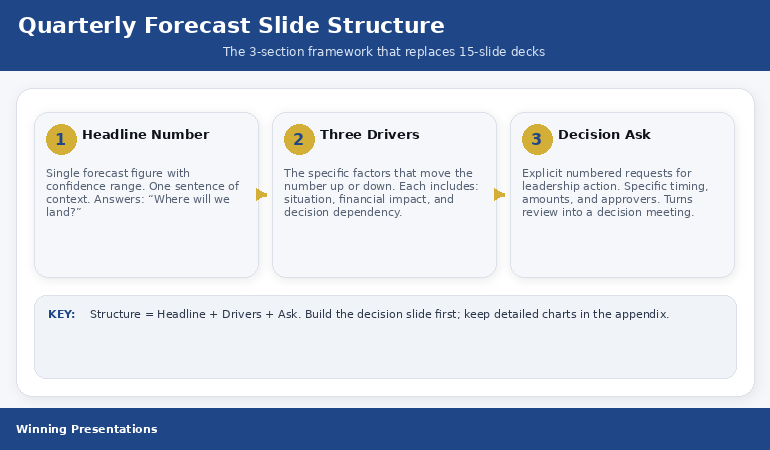
Quick answer: The quarterly forecast slide that executives actually use has three sections: the Headline Number (where you’ll land, expressed as a single figure with a confidence range), the Three Drivers (the specific factors that move the number up or down), and the Decision Ask (what you need from leadership to hit the better end of the range). Most teams bury these three things inside 15 slides of supporting data. Pull them onto one slide. It takes 20 minutes once you know the structure.
📋 Building a quarterly forecast presentation this week? The Executive Slide System (£39) includes the QBR template with the exact 3-section forecast structure — plus AI prompts to populate each section from your data in minutes.
Jump to:
I’ve reviewed quarterly forecast presentations across banking, technology, pharmaceuticals, and professional services for more than two decades. The pattern is the same in every industry.
Someone on the finance team spends hours pulling data from three systems, building charts that show quarter-over-quarter trends, adding commentary boxes that explain every variance, and layering in scenario models that account for best case, worst case, and “realistic” case. The deck runs to 12-18 slides. The meeting runs to 45 minutes. The executive team asks two questions. Both of them could have been answered from a single, well-structured slide.
The problem isn’t the data. The problem is that most quarterly forecast slides are built to defend rather than decide. They’re designed to show how much work went into the analysis. Executives don’t care about the work. They care about where the number lands and what they need to do about it.
Here’s the structure that changes that — and yes, you can build it in 20 minutes once you’ve done it twice.
Why Most Quarterly Forecast Slides Fail Executives
The failure sits in a single misalignment. Finance teams build forecast slides to be complete. Executives need forecast slides to be clear.
Complete means every line item, every assumption, every variance explained. Clear means one number, three reasons, one decision. Complete is a spreadsheet printed on a slide. Clear is a decision tool. When you show up with complete, the executive has to do the work of extracting what matters. That’s your job — not theirs.
I watched a VP of Engineering present a quarterly review with 47 data points on screen. The CEO asked one question: “So are we on track or not?” He couldn’t answer in one sentence. Not because he didn’t know — because his slide didn’t force him to distil it down. The QBR presentation structure is designed to prevent exactly this failure.
The fix isn’t less data. It’s better architecture. Three sections, one slide, and the data lives in the appendix where it belongs — ready for the CFO who wants to drill into regional breakdowns, but not blocking the CEO who wants to make a decision.
📈 The Quarterly Forecast Structure That Gets Executive Decisions in One Meeting
The Executive Slide System includes the QBR and Project Status templates — built around the Headline Number / Three Drivers / Decision Ask structure that turns forecast meetings into decision meetings:
- The single-slide quarterly forecast layout that replaces 15-slide decks (the exact structure described in this article)
- AI prompts that pull your data into the 3-section framework in under 20 minutes
- Executive Summary and Team Dashboard templates for the supporting slides your CFO will want
- The appendix slide structure that satisfies detail-oriented stakeholders without cluttering the main deck
Get the Executive Slide System → £39
Built from 24 years of quarterly reviews in banking — where the forecast slide decides whether projects get funded or killed.
Section 1: The Headline Number
The top third of your forecast slide has one job: tell the executive where you expect to land. One number. One confidence range. One sentence of context.
Here’s what this looks like in practice: Q2 Revenue Forecast: £4.2M (range: £3.8M–£4.6M). Below that, a single line: “Tracking 6% above plan, contingent on Enterprise pipeline closing at historical rates.”
That’s it. No chart. No trend line. No quarter-over-quarter comparison. Those belong in the appendix. The headline number answers the CEO’s first question — “Where are we?” — before she has to ask it.
Most teams resist this because it feels reductive. It is reductive. That’s the point. Your job in a quarterly forecast isn’t to display comprehensiveness. Your job is to give a busy executive a decision anchor. The headline number is that anchor. Everything else hangs off it.
The confidence range is non-negotiable. A single number without a range is either optimistic or sandbagged — and the executive knows it. The range signals honesty. It also sets up Section 2, because the natural follow-up question is: “What moves us from the low end to the high end?”
Section 2: The Three Drivers
The middle section answers the question the headline number creates: what moves the forecast up or down?
Not ten factors. Not “market conditions.” Three specific, named drivers. Each one should be a lever the executive team can actually pull — or at least understand why they can’t.
For example: Driver 1: Enterprise pipeline conversion — three deals worth £1.1M total are in late-stage negotiation. If all three close, you hit the top of the range. If two close, you’re at midpoint. If one, you’re near the floor. Driver 2: Professional services margin — two projects running 15% over budget on labour. Resolution depends on a staffing decision this quarter. Driver 3: New product adoption — the Q1 launch is tracking at 40% of target. Acceleration depends on the marketing spend decision that hasn’t been approved yet.
Notice what each driver includes: the specific situation, the financial impact, and the decision or dependency that determines the outcome. That’s the structure. Situation, impact, dependency. Three drivers, each with three components. It fits on one-third of a slide.
This is where the operational review presentation framework becomes useful — it applies the same driver-based logic to progress updates, not just financial forecasts.
Need the quarterly slide template for this structure? The Executive Slide System includes the QBR and Project Status templates with this exact Headline / Drivers / Decision framework — plus AI prompts to draft your forecast slide from raw data in minutes.
Section 3: The Decision Ask
The bottom third of the slide is where most forecast presentations fall apart — because most forecast presentations don’t have a decision ask at all.
They end with the data. The implicit message is: “Here’s what the numbers say. Any questions?” The executive team nods, asks a few clarifying questions, and moves to the next agenda item. Nothing gets decided. Nothing changes.
The Decision Ask changes that. It’s a direct, specific request for action: “To hit the high end of the range, I need three things: (1) approval to extend the Enterprise sales cycle by offering Q3 payment terms, (2) a staffing decision on the two over-budget projects by March 28, and (3) reallocation of £40K in marketing budget to the new product launch.”
That’s a slide that drives action. The executive doesn’t have to translate data into decisions — you’ve done it for them. The meeting shifts from “let’s review the numbers” to “let’s approve or reject these three requests.” That’s the difference between a forecast presentation and a decision meeting.
When I worked in banking, the quarterly reviews that got things done all had this structure. The ones that didn’t ended with “let’s take this offline” — which is corporate for “nothing happened.”

⏱️ Stop Spending Days on Forecast Decks That Get Skimmed in Seconds
The Executive Slide System gives you the pre-built forecast structure — so you fill in your numbers instead of designing slides from scratch:
- QBR and Project Status templates with the 3-section layout — ready to populate
Get the Executive Slide System → £39
Used by finance leaders, VPs, and programme directors who are tired of rebuilding the same forecast deck every quarter.
The 20-Minute Build Process
Here’s the step-by-step for building your quarterly forecast slide in 20 minutes — once you have your data to hand.
Minutes 1–5: Write the Headline Number. Pull your topline forecast figure. Add the confidence range. Write one sentence of context. If you can’t write the context in one sentence, you haven’t distilled the forecast enough. Force yourself. “Tracking 6% above plan” or “At risk due to pipeline slippage” or “On track if Q3 staffing is approved.” One sentence.
Minutes 6–12: Identify the Three Drivers. Open your forecast model. Ask yourself: what are the three things that most move this number? Not the ten things. The three. For each, write the situation (one line), the financial impact (one number), and the dependency (who or what needs to act). If a driver doesn’t have a clear dependency, it’s a background factor — move it to the appendix.
Minutes 13–18: Write the Decision Ask. For each driver, extract the decision or approval needed. Combine them into a numbered list. Be specific about timing, amounts, and who approves. “Approval to extend payment terms” is actionable. “We need more flexibility” is not.
Minutes 19–20: Check the appendix signal. Add a footer line to the slide: “Supporting data: slides 6–12.” This tells the CFO that the detail exists without putting it on the main slide. It’s a trust signal — you’ve done the work, you’re just not inflicting all of it on the room.
The CFO-approved budget presentation template uses the same principle — leading with the decision, supporting with data on request.
Running a quarterly review meeting soon? The full QBR presentation guide covers the complete meeting structure — forecast, progress, and decision slides — so your quarterly review drives outcomes, not just updates.
PAA: Quick Answers on Quarterly Forecast Presentations
How many slides should a quarterly forecast presentation have?
The main deck should be 3–5 slides: one forecast summary (the 3-section structure), one progress update, one decisions/actions slide, and 1–2 optional context slides. Supporting data lives in an appendix of 5–10 slides that you reference but don’t present unless asked. The goal is a 15-minute meeting, not a 45-minute data review.
What’s the difference between a quarterly forecast and a QBR?
A quarterly forecast is one element of a QBR (Quarterly Business Review). The forecast covers where the numbers will land. A full QBR also includes progress against goals, operational highlights, risks, and resource requests. The 3-section forecast slide described here is the financial anchor of the broader QBR deck.
Should you present best case, worst case, and expected case separately?
No. Presenting three separate scenarios turns a decision meeting into a discussion about assumptions. Instead, present one expected number with a confidence range. Use the Three Drivers section to show what pushes the outcome toward the high or low end. This keeps the conversation focused on actions, not probabilities.
Is This Right For You?
✓ This is for you if:
- You present quarterly forecasts to senior leadership and the meeting always runs over
- Your forecast slides get questions like “so what’s the bottom line?” — meaning the structure isn’t doing its job
- You want a repeatable template so you’re not rebuilding the forecast deck from scratch every quarter
✗ This is NOT for you if:
- Your audience is a finance team that needs granular model-level detail (that’s a working session, not a presentation)
- You’re building an annual strategic plan (different structure, different purpose)
🎯 The Quarterly Presentation System Used by Finance Leaders Across Three Continents
The Executive Slide System was built from real quarterly reviews in banking, technology, and professional services — where the forecast slide decides what gets funded:
- 22 templates including QBR, Executive Summary, and Budget Request — each built for the decision-first format
- 51 AI prompt cards that turn your raw data into structured executive slides (3 prompts per template: Draft, Refine, Executive Polish)
- The 15 Scenario Playbook pages that cover quarterly reviews, budget requests, board meetings, and investor updates
- CFO Questions Checklist — the questions financial executives will ask, and how to pre-answer them on the slide
Get the Executive Slide System → £39
Built from 24 years of quarterly reviews at JPMorgan Chase, PwC, RBS, and Commerzbank — where forecast slides determine project survival.
Frequently Asked Questions
How do I handle it when my forecast data keeps changing right up to the meeting?
Lock the headline number 48 hours before the meeting. Any changes after that go into a verbal caveat at the start: “Since the deck was circulated, Driver 2 has shifted — I’ll update you live.” This prevents the endless cycle of re-building slides the night before. The 3-section structure helps because you only need to update three data points, not fifteen slides.
What if my leadership team wants to see all the detail on one slide?
This usually means they don’t trust the summary — which means previous forecast slides have surprised them. Build trust by including the appendix reference on the main slide and proactively saying: “The supporting model is on slides 6 through 12 — happy to go through any line item.” Once they see that the detail is there and the summary is accurate, they’ll stop asking for it on the main slide.
Can I use this structure for a board-level forecast presentation?
Yes — in fact, it’s even more important at board level. Board members have less context than your executive team. They need the headline, the drivers, and the ask even more urgently. The only difference: your confidence range may need a brief methodology note in the appendix for governance purposes.
📬 The Winning Edge
One email per week. Executive presentation strategies, slide structures that actually work, and the mistakes I see in boardrooms across three continents. No fluff. No filler. Just the edge.
📥 Free resource: Download the CFO Questions Cheatsheet — the questions financial executives ask in quarterly reviews, and how to pre-answer them on your slides.
Read next: If quarterly presentations trigger anxiety, here’s what I learned about recovery from my worst presentation moment. And if the Q&A after your forecast presentation is what worries you most, read why the best Q&A performers wait three seconds before answering.
Your next quarterly forecast presentation is coming. Before you open PowerPoint and start building 15 slides of data, try this: write the headline number, name the three drivers, and draft the decision ask. Then build one slide around those three sections. You’ll spend 20 minutes instead of two days — and your leadership team will actually make decisions in the meeting.
About the Author
Mary Beth Hazeldine is the Owner & Managing Director of Winning Presentations. With 24 years of corporate banking experience at JPMorgan Chase, PwC, Royal Bank of Scotland, and Commerzbank, she has delivered high-stakes presentations in boardrooms across three continents.
A qualified clinical hypnotherapist and NLP practitioner, Mary Beth combines executive communication expertise with evidence-based techniques for managing presentation anxiety. She has trained thousands of executives and supported high-stakes funding rounds and approvals.