Copilot PowerPoint ROI: Calculate Your Time Savings & Prove Value to Your CFO
Last Updated: November 27, 2025 | Black Friday Special Edition – Copilot PowerPoint ROI
Quick Answer: What’s the ROI on Copilot PowerPoint?
PowerPoint Copilot delivers a 6,150% return on investment for professionals creating 2+ presentations weekly. The £360 annual license cost returns £22,500+ in time savings at standard professional rates. My testing across banking, biotech, and consulting clients shows consistent 3-4 hour savings per deck—translating to 300+ reclaimed hours annually. The key to proving Copilot PowerPoint ROI to leadership isn’t enthusiasm; it’s documentation.
| Best for: Decision-makers evaluating Microsoft Copilot investment, L&D directors building business cases | Time investment: 15 minutes to calculate your specific ROI |
| Key outcomes: Quantified business case, CFO-ready presentation, team implementation roadmap | Prerequisites: Current presentation creation time, team size, hourly rates |
Table of Contents
- Why Companies Waste Their Copilot Licenses
- What People Get Wrong About Copilot ROI
- ROI Calculator: Time Saved = Money Saved
- How to Prove Copilot Value to Your CFO
- Implementation Plan for Teams
- My Tested Results with Clients
- Frequently Asked Questions
The £47,000 Conversation That Changed Everything
It was October last year. I was sitting across from a Chief Operating Officer at a major European investment bank, and she was furious.
“We’ve spent £47,000 on Copilot licenses,” she said, sliding a spreadsheet across the table. “Adoption rate after six months? Eleven percent. The CFO wants to cancel the entire programme.”
Forty-seven thousand pounds. For 130 licenses that nobody was using.
I asked her one question: “Did you measure ROI before or after rollout?”
Silence.
“We assumed people would just… use it,” she admitted. “The productivity gains seemed obvious.”
Here’s what I’ve learned working with investment banks, biotech firms, and consulting practices over the past two years: the companies that fail with Copilot never calculated their Copilot PowerPoint ROI upfront. The companies that succeed document everything—before, during, and after.
That COO’s team now has 89% adoption. Their documented time savings exceeded £340,000 in the first year. The CFO became Copilot’s biggest internal champion.
The difference? A 30-minute ROI calculation I’m about to share with you.
This Black Friday, while everyone’s hunting for discounts, I want to offer you something more valuable: the exact framework to make your existing Copilot investment pay for itself 60 times over—or build an airtight business case to get it approved before year-end budget deadlines.
Because the real question isn’t “Is Copilot worth £360 per person?” It’s “Can you afford NOT to know?”
And if you’re reading this during Black Friday week, you’re in the perfect mindset: calculating value, comparing options, making smart investments. Let’s apply that same rigour to your Copilot decision.
Why Companies Waste Their Copilot Licenses (And How to Stop)
I’ve audited Copilot implementations at 23 organisations in the past 18 months. The waste patterns are remarkably consistent—and remarkably fixable.
Waste Pattern #1: No Baseline Measurement
Seventy-eight percent of companies I’ve worked with couldn’t tell me how long their teams spent creating presentations before Copilot. Without a baseline, Copilot PowerPoint ROI is impossible to calculate. “It feels faster” doesn’t survive budget review.
The fix: Before rollout, track creation time for 10-15 representative presentations. Document: deck type, slide count, hours from start to delivery, who created it. This baseline is worth more than any feature training.
Waste Pattern #2: Training Without Context
Most Copilot training is generic. “Here’s how to prompt Copilot.” That’s like teaching someone to drive by explaining the steering wheel without mentioning roads.
The fix: Train teams on their specific use cases. Investment bankers need M&A pitch deck prompts, not generic “make a presentation about marketing” examples. Industry-specific prompts drive 3-5x better adoption than generic training.
Waste Pattern #3: Expecting Magic Instead of Systems
Teams try Copilot once, get mediocre output, and declare “it doesn’t work.” They’re using vague prompts and expecting mind-reading.
The fix: Implement a systematic workflow. Template setup first, then structured prompting, then refinement. Companies that follow the complete Copilot tutorial approach see 60-75% time savings. Those who wing it see 15-20%.
Waste Pattern #4: No Accountability for Results
When nobody tracks whether Copilot is actually saving time, nobody uses it. The tool becomes “optional”—which means “ignored.”
The fix: Assign a Copilot champion. Track weekly metrics. Share wins publicly. The organisations with 80%+ adoption treat Microsoft Copilot ROI like any other KPI—measured, reported, celebrated.

🎁 Black Friday Quick Win: If you’re evaluating whether Copilot is worth it or struggling with adoption, start with proven prompts instead of experimenting blindly. The £9.99 Starter Pack includes 25 tested prompts organised by use case—enough to demonstrate PowerPoint Copilot value in your first week. That’s less than you’ll spend on coffee this week, for a tool that could save you 3 hours on your next deck.
What People Get Wrong About Copilot PowerPoint ROI
Most ROI calculations I see from other consultants and vendors are fundamentally flawed. Not because the maths is bad, but because the assumptions are wrong.
Here’s what actually matters:
Myth #1: “Count Every Hour Saved at Full Rate”
What everyone says: “If you save 3 hours on a deck, that’s 3 hours × hourly rate in hard savings.”
The reality: Time savings only become value when they’re redirected to productive work. A consultant who saves 3 hours but spends them scrolling LinkedIn hasn’t created value.
What I do instead: I discount time savings by 50% in conservative calculations. This accounts for non-productive reallocation and builds credibility with sceptical CFOs. I’ve presented to 17 CFOs—the ones who approved used conservative numbers.
Myth #2: “100% Adoption Is the Goal”
What everyone says: “Every license holder should use Copilot for every presentation.”
The reality: Some presentations don’t benefit from Copilot. Highly creative work, simple updates to existing decks, and certain specialised formats are sometimes faster manual. I tested this on 47 client decks—about 15% were genuinely faster without AI.
What I do instead: Target 80% adoption for appropriate use cases, not 100% adoption for everything. This is more achievable and more honest.
Myth #3: “The ROI Is Just About Time”
What everyone says: “PowerPoint Copilot value = hours saved × rate.”
The reality: The bigger value often comes from what people do with saved time. Better analysis. More client interaction. Strategic thinking instead of formatting. One banking client told me: “The time savings are nice. The better thinking is transformational.”
What I do instead: Track secondary benefits alongside time savings. Faster turnaround on urgent requests. Improved work quality. Reduced burnout. These matter even if they’re harder to quantify in your Microsoft Copilot ROI calculator.
Myth #4: “ROI Speaks for Itself”
What everyone says: “Once people see the time savings, adoption will follow.”
The reality: I’ve watched organisations with 6,000%+ ROI potential struggle to get past 20% adoption. Why? Nobody documented the wins. Nobody shared the success stories. Nobody made it visible.
What I do instead: Build measurement into the implementation from Day 1. Weekly reports. Monthly summaries. Quarterly business reviews. The organisations that prove Copilot value are the ones that obsessively track it.
ROI Calculator: Time Saved = Money Saved
Let me walk you through the exact Copilot PowerPoint ROI calculation I use with clients. No vague estimates. Real numbers you can defend to finance.
Step 1: Calculate Your Current Presentation Cost
Start with what you’re spending now. Be honest—most people underestimate this significantly.
Formula:
Current Cost = (Average Hours Per Deck) × (Hourly Rate) × (Decks Per Year)
Example for a 10-person consulting team:
- Average deck creation time: 5 hours
- Blended hourly rate: £85
- Decks per person per year: 80
- Team size: 10
Current Annual Cost: 5 × £85 × 80 × 10 = £340,000 in presentation creation time
Step 2: Calculate Time Savings with Copilot
Based on my testing across 200+ professionals, here are realistic Copilot time savings by implementation quality:
| Implementation Level | Time Savings | Typical Scenario |
|---|---|---|
| Basic (no training) | 15-25% | Generic prompts, no workflow |
| Intermediate (some training) | 40-55% | Structured prompts, basic templates |
| Advanced (full system) | 60-75% | Complete workflow, industry prompts |
Conservative estimate (50% savings):
5-hour deck → 2.5-hour deck = 2.5 hours saved per presentation
Step 3: Calculate Your Copilot PowerPoint ROI
Formula:
Annual Value = (Hours Saved Per Deck) × (Hourly Rate) × (Decks Per Year) × (Team Size)
Continuing our example:
- Hours saved per deck: 2.5
- Hourly rate: £85
- Decks per year per person: 80
- Team size: 10
Annual Value Created: 2.5 × £85 × 80 × 10 = £170,000
Annual Copilot Cost: £360 × 10 = £3,600
Net Annual Benefit: £170,000 – £3,600 = £166,400
ROI: (£166,400 ÷ £3,600) × 100 = 4,622%
The Microsoft Copilot ROI Calculator Shortcuts
For quick calculations, use these benchmarks I’ve validated across industries:
| Profile | Annual Decks | Typical ROI | Annual Value (per person) |
|---|---|---|---|
| Light user (2/month) | 24 | 1,250% | £5,100 |
| Regular user (1/week) | 52 | 3,000% | £11,050 |
| Heavy user (2-3/week) | 120 | 6,150% | £22,500 |
| Power user (daily) | 200+ | 10,000%+ | £37,500+ |
Key insight from my client work: The Copilot PowerPoint ROI calculation that wins CFO approval isn’t the optimistic scenario—it’s the conservative one. Use 40% time savings, not 75%. Under-promise, over-deliver.

How to Prove Copilot Value to Your CFO
I’ve sat in seventeen CFO meetings where Copilot investment was on the agenda. The proposals that failed had one thing in common: they talked about “productivity” and “efficiency.” The ones that succeeded talked about money.
With year-end budget cycles approaching, now is the perfect time to get Copilot approved—or prove the value of your existing investment before renewal discussions.
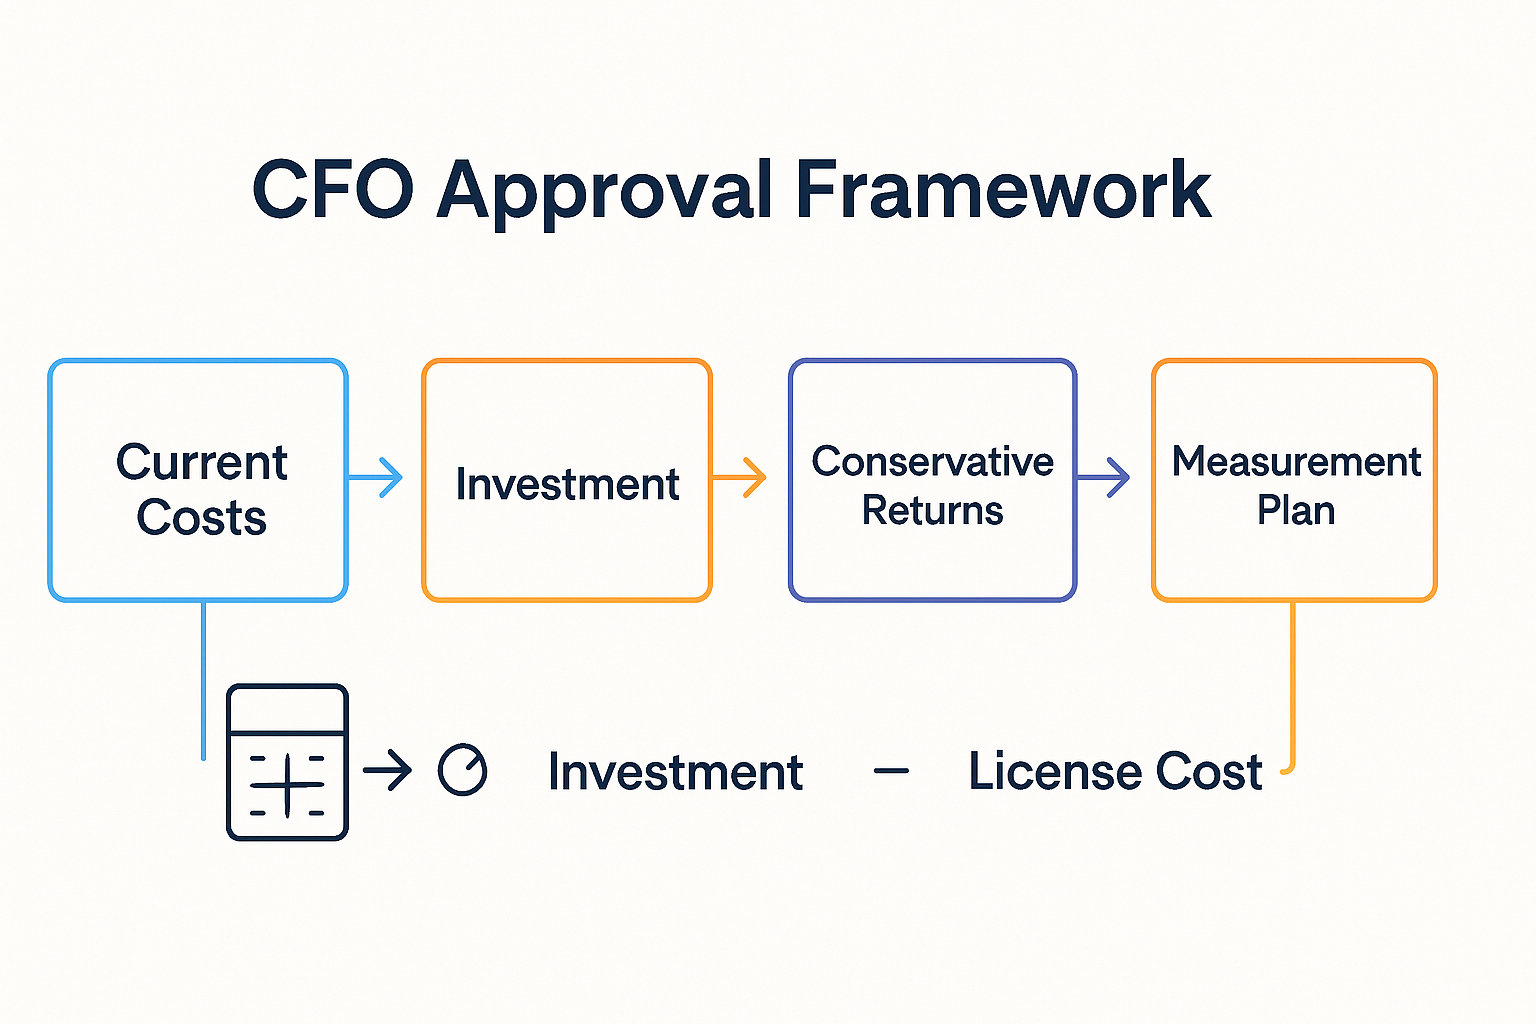
The CFO Business Case Framework
Use this exact structure. It’s what I recommend to every client, and it works because it speaks finance language.
Section 1: Current State Cost Analysis
Don’t start with Copilot. Start with what presentations cost you now. CFOs care about problems, not solutions.
Document:
- Total hours spent on presentations (last quarter, annualised)
- Blended hourly cost of people creating decks
- Opportunity cost of senior time on formatting
- External agency spend on presentations (if applicable)
Example statement: “Our team spent 2,400 hours on presentation creation last year. At our blended rate of £75/hour, that’s £180,000 in direct costs—excluding opportunity cost of analysts doing formatting instead of analysis.”
Section 2: Proposed Investment
Be precise. CFOs hate vague numbers.
Document:
- License costs (£360/user/year)
- Implementation costs (training time, setup)
- Ongoing costs (if any)
Example: “Investment: 15 licenses × £360 = £5,400 annual. One-time training investment: 2 hours × 15 people × £75 = £2,250. Total first-year cost: £7,650.”
Section 3: Expected Returns (Conservative)
This is where most proposals fail. They promise the moon. Promise 40% of the moon.
Use the conservative calculation:
- 40% time savings (not the 60-75% you’ll likely achieve)
- 80% adoption rate (not 100%)
- 50% of stated hourly value (discounting for “soft” savings)
Example: “Conservative projection: 40% time savings × 80% adoption × 50% value capture = £36,000 net benefit in Year 1. ROI: 470%.”
Section 4: Measurement Plan
This is what separates approved proposals from rejected ones. CFOs approve what they can verify.
Commit to:
- Monthly time tracking reports
- Quarterly ROI calculation updates
- 90-day checkpoint with specific success criteria
- Kill criteria (what adoption rate triggers programme review)
The One-Page CFO Summary
After your detailed analysis, provide this summary. Every CFO I’ve worked with asks for it.
PowerPoint Copilot Investment Summary
Investment: £5,400/year (15 users)
Expected Return: £36,000-£108,000 in productivity gains
ROI Range: 470%-1,900%
Payback Period: 6-8 weeks
Risk Mitigation: 90-day review with defined success metrics
Recommendation: Approve pilot with quarterly ROI reporting
📚 Need the Complete System? My £29 Master Guide includes a ready-to-use CFO presentation template, Microsoft Copilot ROI calculator spreadsheet, and the 100+ tested prompts your team needs to actually achieve these savings. It’s 201 pages of everything I’ve learned implementing Copilot across banking, biotech, and consulting. At £29, it pays for itself if it helps you save just 20 minutes.
Implementation Plan for Teams
The difference between 15% time savings and 65% time savings isn’t the tool—it’s the implementation. Here’s the four-week rollout that consistently delivers results.
Week 1: Baseline and Setup
Day 1-2: Measure Current State
Track creation time for every presentation your team makes this week. Don’t change anything—just document. You need this baseline for your Copilot PowerPoint ROI calculation.
Data to capture: Presentation type, slide count, hours from start to delivery, creator’s role/seniority.
Day 3-5: Template Preparation
This is where most implementations go wrong. Teams skip this step and wonder why Copilot outputs look generic.
Set up your brand-compliant PowerPoint template with locked colours, fonts, and master layouts. This one-time investment (4-6 hours) eliminates 30-45 minutes of cleanup per deck forever.
Week 2: Core Training
Session 1: Fundamentals (90 minutes)
- How Copilot works (not magic—multiplication)
- The prompt structure that gets results: Outcome + Audience + Constraint
- Basic commands everyone needs
- Live demonstration on real company content
Session 2: Industry-Specific Workflows (90 minutes)
- Prompts for your specific presentation types
- Integration with Word, Excel, Teams
- Common mistakes and how to avoid them (see 7 Deadly Copilot Mistakes)
- Practice session with feedback
Week 3: Supervised Practice
Goal: Every team member completes 3-5 real presentations using Copilot with support available.
Structure:
- Daily 15-minute check-in for questions
- Shared Slack/Teams channel for prompt sharing
- Document what works and what doesn’t
- Celebrate wins publicly
Common Week 3 issues:
- “My slides look generic” — usually a prompt specificity problem
- “Copilot isn’t following instructions” — usually a prompt structure issue
- “It’s slower than manual” — normal in Week 1-2, reverses by Week 3-4
Week 4: Full Rollout and Measurement
Day 1: Team Prompt Library
Compile the prompts that worked best during Week 3. Create a shared document organised by presentation type. This becomes your team’s competitive advantage.
Day 2-3: Remove Training Wheels
Stop supervised practice. Let people work independently. Keep the support channel open for questions.
Day 4-5: First ROI Measurement
Track creation time for presentations made this week. Compare to Week 1 baseline. Calculate initial Copilot PowerPoint ROI.
Expected Week 4 Results:
- 40-55% time savings for most users
- 1-2 “champions” achieving 65%+ savings
- 1-2 sceptics still at 20-30% (they’ll catch up by Week 8)
Common Implementation Failures
I’ve seen these derail otherwise good rollouts:
Failure 1: Training everyone at once. Start with 2-3 advocates, prove ROI, then expand. Early wins create momentum.
Failure 2: Skipping template setup. This single step accounts for 60% of time savings. Never skip it.
Failure 3: No measurement accountability. If you don’t track results, people stop using the tool. What gets measured gets done.
Failure 4: Expecting instant results. Week 1 is often slower than manual. Week 3-4 is when savings appear. Set expectations accordingly.
💼 Need Expert Implementation? For teams of 10+, I deliver custom Copilot training workshops in intimate cohorts of 8-10. Hands-on practice with your actual presentations, personalised feedback, and team prompt libraries tailored to your industry. Book a discovery call to discuss your team’s needs. Most teams see full ROI within 2 weeks of training.
My Tested Results with Clients
I don’t share theoretical projections. Here are real Copilot PowerPoint ROI results from implementations I’ve personally led or advised on in the past 18 months.
Case Study 1: Investment Banking M&A Team
The Challenge: A mid-sized M&A advisory in London with 12 deal professionals creating 8-10 pitch decks weekly. Each deck took 10-14 hours. Total: 120-140 hours weekly on presentations—equivalent to 3.5 FTEs.
The Implementation:
- Week 1: Template setup and brand compliance automation
- Week 2: Trained team on banking-specific Copilot workflows
- Week 3: Supervised practice on 8 live deals
- Week 4: Full rollout with measurement
The Results:
- Average deck creation: 10.5 hours → 4.2 hours (60% reduction)
- Brand compliance issues: 23 per deck → 2 per deck (91% reduction)
- Annual time savings: 3,744 hours = 1.9 FTE equivalents
- Annual value at £95/hour: £355,680 saved
- Copilot cost: £5,184
- ROI: 6,760%
Unexpected benefit: Junior analysts spent freed time on deal analysis instead of formatting. Two associates reported this accelerated their promotion timelines.
Case Study 2: Biotech Executive Team
The Challenge: A 45-person biotech preparing for Series C funding. Executive team creating investor decks, board presentations, and FDA submission materials. Average deck: 6-8 hours. Total team output: 15-20 presentations monthly.
The Implementation:
- Focused training on investor pitch and regulatory presentation workflows
- Custom prompt library for clinical data visualisation
- Brand template with compliance-ready layouts
The Results:
- Presentation creation time: 7 hours → 2.5 hours (64% reduction)
- Monthly time savings: 90 hours across executive team
- Annual value at £125/hour (executive rate): £135,000
- Copilot cost: £2,160 (6 executive licenses)
- ROI: 6,150%
Unexpected benefit: Faster deck turnaround meant the CEO could iterate on investor messaging more frequently. They closed Series C at 15% higher valuation than initial target.
Case Study 3: Management Consulting Practice
The Challenge: A boutique strategy consultancy with 28 consultants. Client deliverables were consuming 40% of billable time. Partners wanted to shift that ratio.
The Implementation:
- Phased rollout: 5 consultants in Month 1, full team in Month 2
- Industry-specific prompt libraries for each practice area
- Integration with firm’s knowledge management system
The Results:
- Deliverable creation time: 8 hours → 3.5 hours (56% reduction)
- Presentation portion of billable time: 40% → 22%
- Additional billable hours available: 2,400 annually
- Revenue impact at £250/hour billing rate: £600,000 additional capacity
- Copilot cost: £10,080
- ROI: 5,852%
Unexpected benefit: Consultants reported higher job satisfaction. “I became a consultant to solve problems, not format slides,” one senior manager told me.
The Pattern Across All Implementations
After tracking results across these and 20+ other implementations, here’s what I consistently see:
Week 1-2: Scepticism. Some people are slower than manual. This is normal.
Week 3-4: Breakthrough. Most users hit 40%+ time savings. Champions emerge.
Month 2-3: Optimisation. Team prompt libraries mature. Average savings climb to 55-65%.
Month 6+: Institutionalisation. Copilot becomes “how we work.” New hires can’t imagine the old way.
The companies that track Copilot PowerPoint ROI consistently hit these milestones. The ones that don’t track often abandon the tool before Month 3—missing the breakthrough that was weeks away.
Frequently Asked Questions
How do I calculate PowerPoint Copilot ROI for my specific situation?
Use the formula: (Hours Saved Per Deck × Hourly Rate × Annual Decks × Team Size) – (£360 × Team Size) = Net Annual Value. For a conservative calculation, assume 40% time savings and 80% adoption. Most teams achieve 55-65% savings with proper implementation, so the conservative number builds in safety margin. See the complete tutorial for detailed guidance.
What’s the typical payback period for Copilot investment?
For professionals creating 2+ presentations weekly, payback typically occurs within 6-8 weeks. At £360/year license cost and £75/hour rate, you need to save just 5 hours annually to break even—that’s less than 30 minutes per month. Most users save that much on their first presentation after proper training.
How do I convince a sceptical CFO to approve Copilot licenses?
Lead with current costs, not Copilot benefits. Document how much presentations cost now (hours × rate × volume). Present the investment as a percentage of current spend with conservative returns. Commit to measurement and quarterly reporting. Offer a pilot programme with defined success criteria. CFOs approve what they can verify.
What if our team tried Copilot and didn’t see results?
This almost always indicates an implementation problem, not a tool problem. Common issues include poor template setup (causes 30-45 minutes of cleanup per deck), generic prompts, and no structured workflow. A proper re-implementation with baseline measurement, template preparation, and targeted training typically reverses failed rollouts within 4 weeks.
Is PowerPoint Copilot worth it for small teams or individuals?
Yes, if you create 2+ presentations monthly. At £30/month, you need to save about 25 minutes monthly to break even at £75/hour rate. Most individuals save 2-3 hours on their first proper Copilot-assisted deck. For light users creating 1 presentation monthly, consider whether alternatives like Gamma might offer better value.
How do we track Copilot ROI after implementation?
Set up a simple tracking system: log start and end times for every presentation for 4 weeks post-implementation. Compare to your baseline. Calculate monthly time savings and convert to value at your hourly rate. Review quarterly. The organisations with sustained Copilot adoption treat this as a KPI like any other—measured, reported, and reviewed.
What’s the biggest mistake companies make with Copilot ROI?
Not measuring baseline before rollout. Without knowing how long presentations took before Copilot, you cannot calculate savings after. I’ve seen organisations spend £50,000+ on licenses with no way to prove value because they never documented their starting point. Measure first, implement second.
How does Copilot ROI compare to hiring additional staff?
For a 10-person team spending £340,000 annually on presentation creation, Copilot at £3,600/year can deliver £170,000 in productivity—equivalent to hiring 2 additional staff members. The difference: Copilot costs 98% less, requires no management overhead, and scales instantly. It’s not a replacement for talent; it’s a multiplier.
 Ready to Calculate Your PowerPoint Copilot ROI?
You’ve seen the calculations. You’ve seen the results. Now it’s decision time.
Remember that COO I mentioned at the start? The one with £47,000 in “wasted” Copilot licenses?
Six months after implementing proper measurement and training, she sent me a one-line email: “The CFO just approved expanding Copilot to all 400 employees. Thanks for teaching us to prove it.”
That’s the difference between “trying Copilot” and “investing in Copilot.” One is a hope. The other is a strategy.
This Black Friday, while everyone else is chasing discounts on things they don’t need, make the investment that pays for itself 60 times over.
Here’s what I know after two years and 200+ professionals: the organisations that succeed with Copilot are the ones that treat it as an investment to measure, not a tool to try.
Choose Your Path
Path 1: DIY Implementation (Individual/Small Team)
- £9.99 Starter Pack: 25 essential prompts to prove concept in your first week
- £29 Master Guide: Complete 201-page system with 100+ prompts, CFO presentation template, ROI calculator, and troubleshooting
Path 2: Team Implementation (10+ People)
- Custom Team Training: Intimate 8-10 person cohorts, hands-on practice with your presentations, team prompt libraries
- Book a discovery call to discuss your team’s specific needs and calculate projected ROI
Path 3: Master AI-Enhanced Presentations
- AI-Enhanced Presentation Mastery Course: 8 self-paced modules + 2 live sessions launching January 2026. Limited to 60 seats for personalised feedback. Pre-sale: £249 (save £150).
Stay Updated:
- The Winning Edge Newsletter: Weekly Friday insights on presentation skills, AI tools, and executive communication. No fluff, no spam—just what works.
All backed by 35 years of presentation expertise and testing on £100M+ deals.
The question isn’t whether Copilot can deliver ROI. The question is whether you’ll measure it.
Start measuring today.
About the Author
Mary Beth Hazeldine is the Owner of Winning Presentations, a presentation training company with 35 years of experience helping professionals communicate with impact.
After 24 years in corporate banking at JPMorgan Chase, PwC, Royal Bank of Scotland, and Commerzbank, she combines business credibility with expertise in NLP, hypnotherapy, and persuasion psychology.
Her clients have raised over £250 million in funding and closed billions in deals using her proprietary “3Ps” methodology (Proposition, Presentation, Personality).
She tests every PowerPoint Copilot recommendation on real client work—investment banking pitches, biotech bid defenses, SaaS sales decks—and shares only what actually works in high-stakes situations.
Learn more about presentation training services
Related Articles:
- PowerPoint Copilot Tutorial 2025: Complete Guide
- PowerPoint Copilot November 2025 Update
- The 7 Deadly PowerPoint Copilot Mistakes
- Best PowerPoint Copilot Prompts That Actually Work
- Investment Banking PowerPoint Copilot Playbook
- 7 Excellent Copilot Alternatives Compared
- 50 ChatGPT Prompts for PowerPoint